The Roland Berger Trend Compendium 2050 focuses on stable, long-term developments …
> The Roland Berger Trend Compendium 2050 is a global trend study compiled by Roland Berger Institute (RBI), the think tank of Roland Berger. Our Trend Compendium 2050 describes the most important megatrends shaping the world between now and 2050 > Our trend views are based on expert sources and assessments. Estimates reflect the normal case, i.e. a stable development of the global economy in the long term > To incorporate today’s uncertainties into strategic planning, we recommend combining the megatrends of the Roland Berger Trend Compendium 2050 with the Roland Berger scenario planning approach
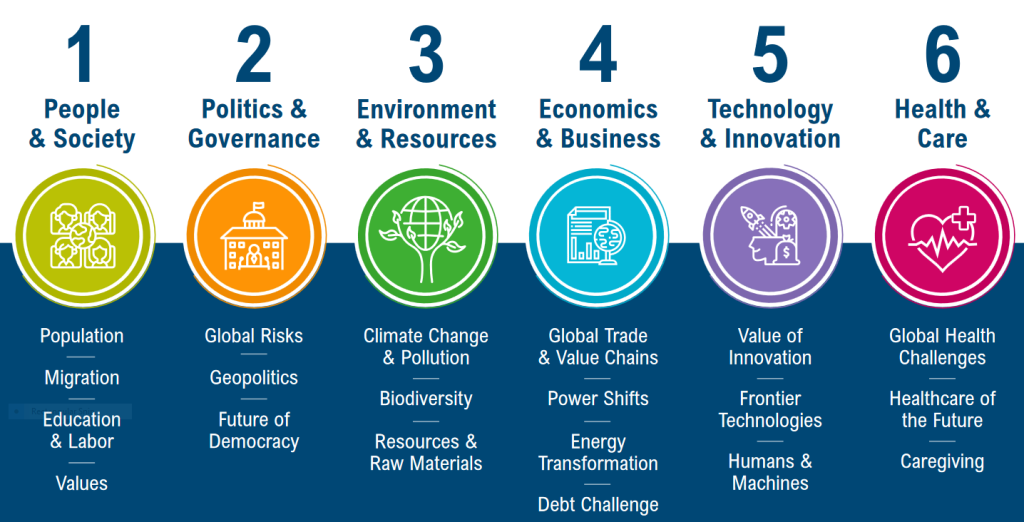
… and covers six megatrends that shape the future development of our world to 2050
Megatrend 1
People & Society
Beyond mere demographics, people and society are at the core of our thinking – People are on the move, are eager to learn and rely on values
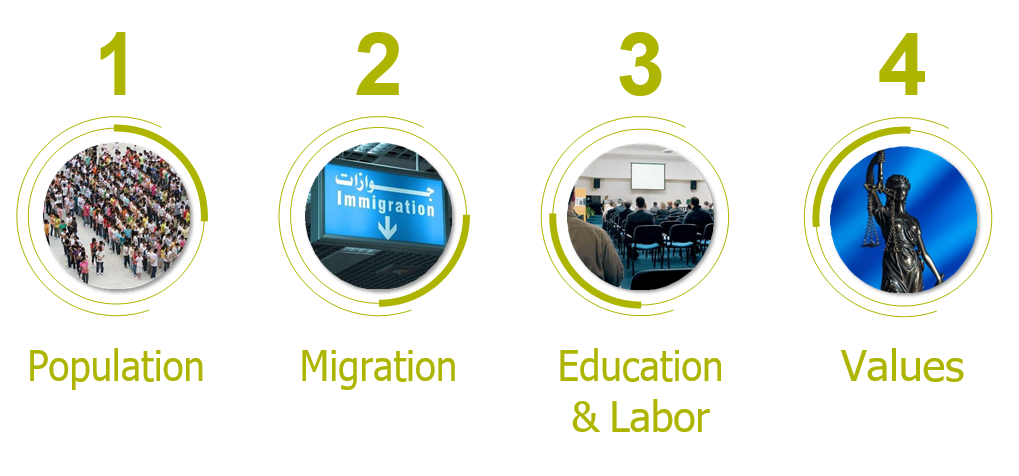
Subtrends of megatrend “People & Society”
1.1
Population
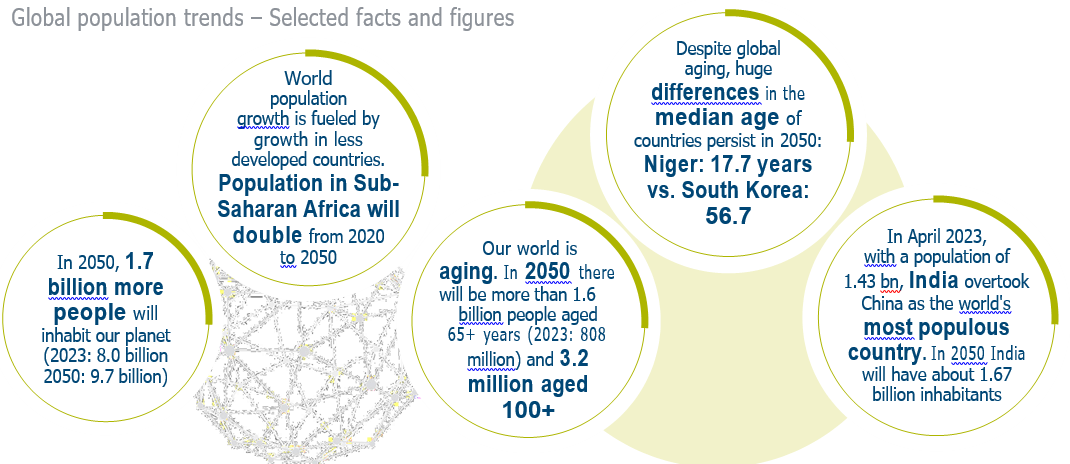
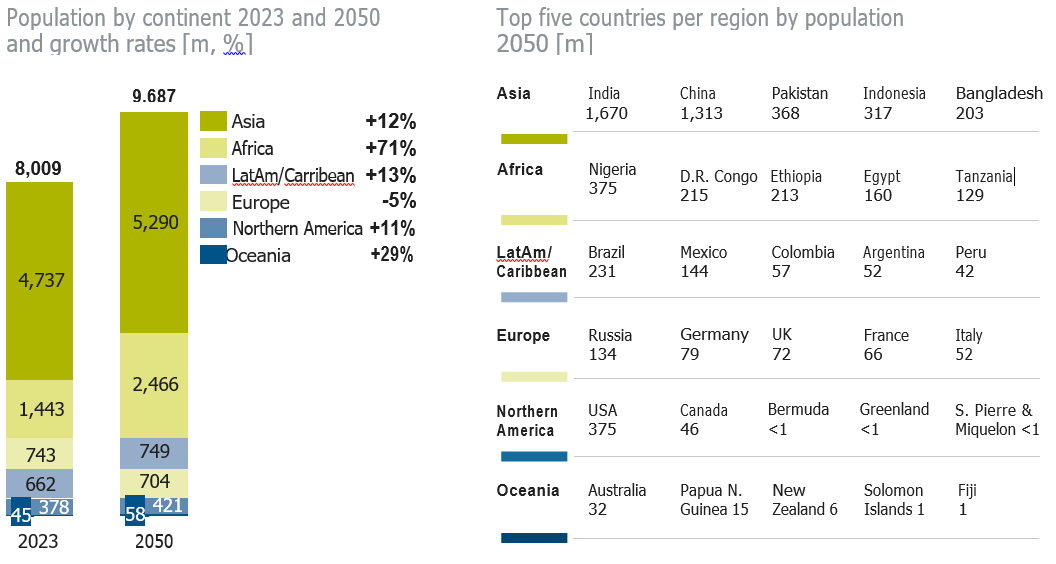
Population trends toward 2050 point to a myriad of changes worldwide for regions as well as countries, their growth rates and age structures
Standing side by side, the predicted 9.7 billion strong population of 2050 would span the equator more than 240 times. However, average global population density will only rise to 74.5 people per sq km1) – around a quarter of the population density of the United Kingdom today
1) Calculation based on the Earth’s land area excluding Antarctica Sources: UN Population Division; UN Population Fund; UN: Roland Berger
Over the next three decades, Africa’s population will increase by more than 1 billion – Asia remains the world’s population giant
The population growth rate is decreasing due to lower fertility rates – In 2050, the vast majority of the 9.7 billion will live in less developed regions
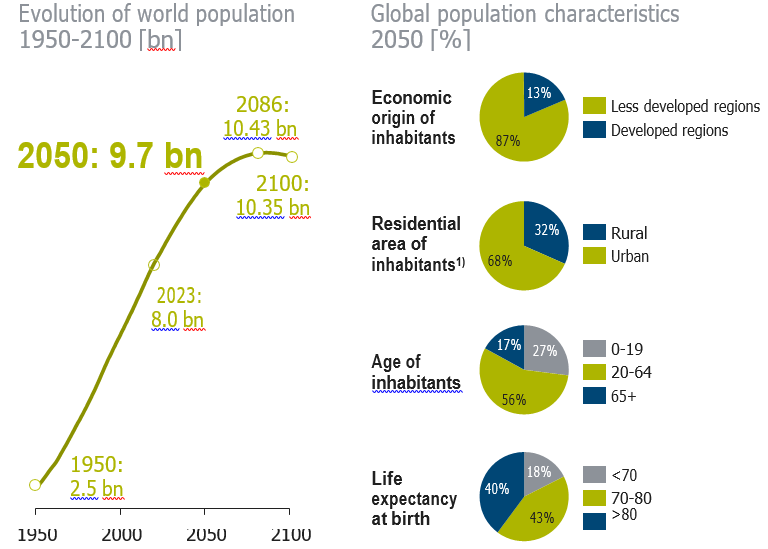
> According to the UN medium variant prediction, the world popu- lation will grow at a slower pace between 2020 and 2050 compared to previous decades, reaching a population of 9.7 billion in 2050
> The evolution of the world population is driven by two factors: the evolution of fertility rates and the evolution of life expectancy
– Global fertility rates are expected to decrease from 2.31 births per woman in 2023 to
2.15 births per woman in 2050. This lowers the rate of population growth
– Average life expectancy is expected to increase from 73.4 years in 2023 to 77.2 years in 2050, globally. This drives population growth, but cannot totally compensate for decreasing fertility rates
> In 2050, the majority of the global population will stem from less developed regions, resides in urban areas, is between 15 and 64 years old and has a life expectancy of more than 70 years
1) The definition of urban areas follows the definitions that are used in each country Sources: UN Population Division; Roland Berger
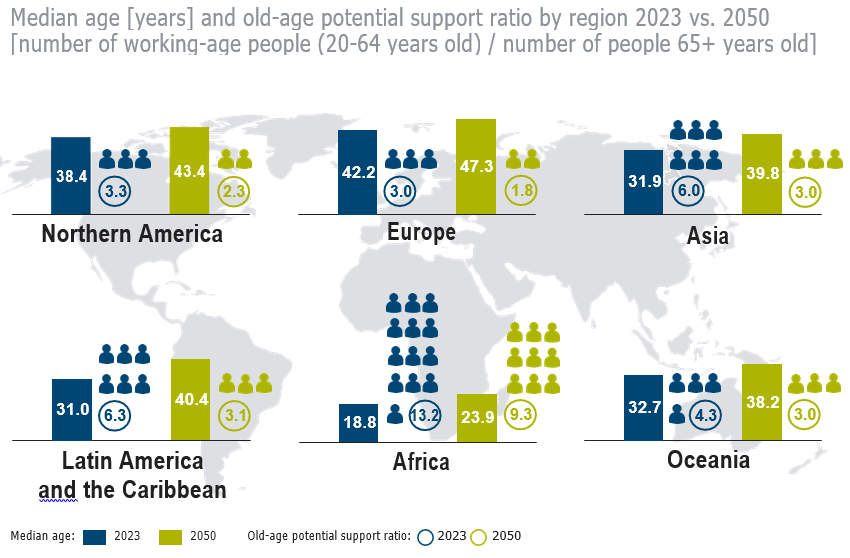
All regions are aging with fewer people of working age having to support more older people – Intercontinental differences remain significant
> A low old-age potential support ratio can have severe consequences for countries where a large share of public expenditure is allocated, for example, to health, caregiving and social security, which is taken up by older members of society to a proportionally larger extent > However, there are several caveats: The old-age support ratio ignores the fact that people above the age of 65 are not necessarily dependent on support as a rising proportion is (still) in work or has access to other financial resources; also, by contrast, not all of those considered of working age are actually working
1.2
Migration
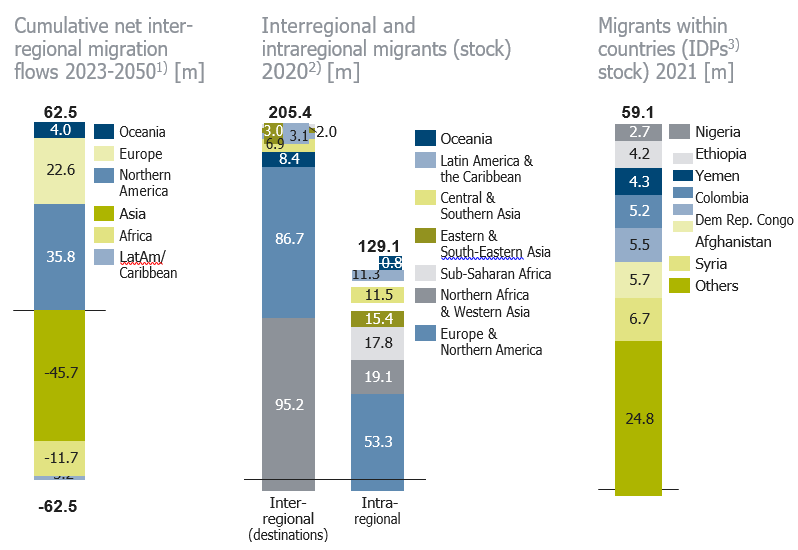
International net migration flows between regions are expected to be on a high level toward 2050 – This reflects only one of many aspects of migration
> According to the UN, “international migrants are defined as either living in a country other than their country of birth or in a country other than their country of citizenship” > The majority of international migrants (interregional and intraregional migrants) are not refugees or asylum seekers having left their home country due to conflicts, persecution or similar, but are defined as migrating for economic, educational or other reasons > In 2021 there have been 31.7 million international refugees and asylum seekers globally; 69% came from just five countries: Syria, Venezuela, Afghanistan, South Sudan, and Myanmar > IDPs are refugees who stay within their own country. 2021, the majority of IDPs (53.2 million) fled conflicts and violence, the remaining 5.9 million fled disasters
1)Interregional migration includes only migration between regions; data are based on UN medium variant forecast; 2)Numbers of interregional migrants are for destination regions; intraregional migration includes only migration between countries within a region; 3) IDPs: internally displaced people
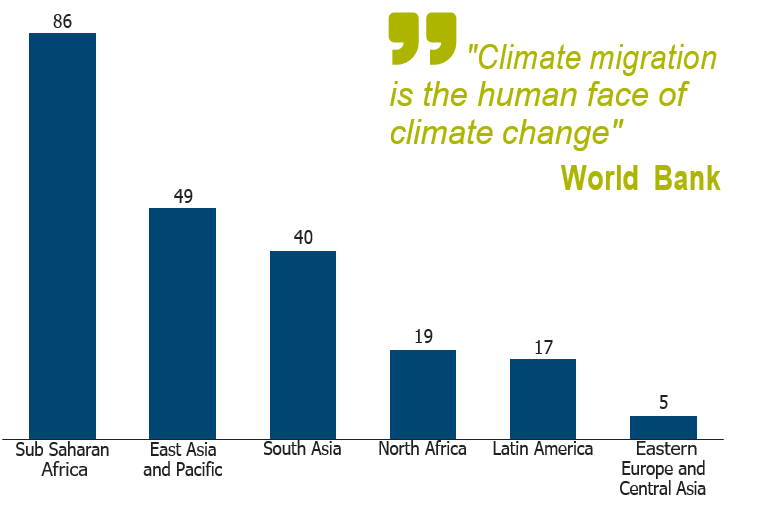
Without global action until 2050, up to 216 million internal climate migrants are forecast – Sub-Saharan Africa and Asia will be affected the most
> Global climate and environmental migration forecasts to 2050 range widely, from 25 million to 1 billion people > The majority of climate migrants will become internally displaced, i.e. they will be forced to move within their own country due to increasing climate change impacts such as rising sea levels, crop failure, water stress etc. > In a pessimistic scenario (high green-house gas emissions combined with unequal development pathways), the World Bank expects 216 million internal climate migrants across the six World Bank regions > According to World Bank estimates, the global community could manage to lower the number of people forced to move due to climate change by 60-80% if we manage to cut greenhouse gases, embed climate migration in development planning, and invest to improve our understanding of internal climate migration in the first place
1.3
Education & Labor
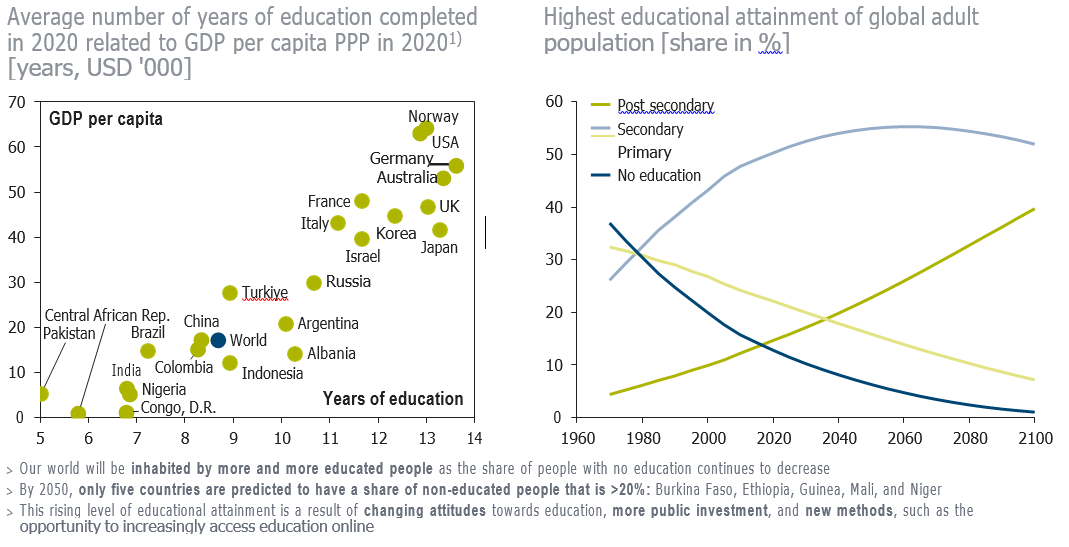
Education is key to individual and national prosperity – Globally, more and more people will have access to higher education
1) Number of years of education completed by people aged 25+. PPP stands for purchasing power parity. GDP per capita PPP in current (2020) international Dollar
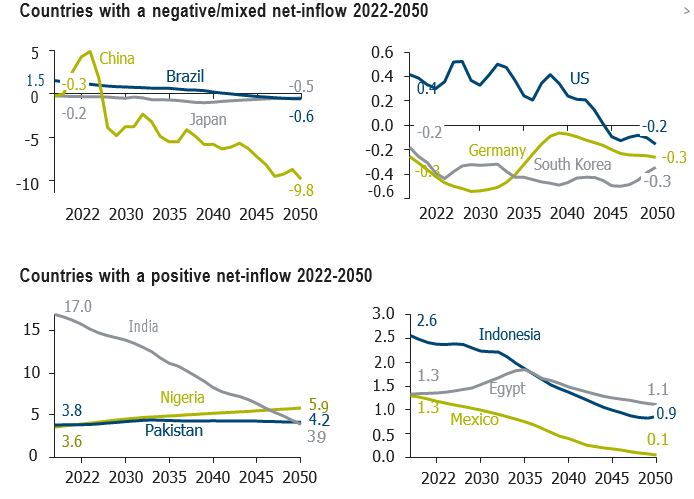
The shortage of skilled workers poses a problem for many labor markets – One possible option is to attract skilled workers from developing economies
Potential net-inflows p.a. into the workforce in the respective year 2022-20501) [m]
> In many advanced economies the youngest age groups of the baby boomers (born 1946-1964) – a very large age cohort – will exit the workforce in coming years > During this period, the new cohort entering the workforce is much smaller, thus resulting in a negative net-inflow in these countries > Because of the (now abolished) one-child-policy, China, the world’s largest labor market, will also face a shrinking workforce from 2027 > Countries with high fertility rates will have a positive net-inflow. Attracting skilled workers from these countries can be one option to counter the looming shortage of such workers in advanced economies – but there are pros and cons: – Pros: easing workforce shortages in advanced economies, attractive prospects for skilled workers from developing economies, further education and training of skilled workers in advanced economies (who can later apply these new skills if returning to their country of origin), remittances supporting the welfare and prosperity in developing economies – Cons: brain drain in developing economies, family separation, cost of attracting and integrating workers, language and cultural barriers > Selected other measures to increase the workforce in advanced economies: increase women’s participation, educate non-skilled people to enable them to enter the workforce, increase the retirement age, increase working times
1.4
Values
People and values: According to the signatories of the UN Declaration of Human Rights, everyone is entitled to the 30 rights and freedoms therein – In reality, claiming these entitlements is mixed and fraught with setbacks
Universal Declaration of Human Rights 1948: Article 2 “Everyone is entitled to all the rights and freedoms set forth in this Declaration, without distinction of any kind, such as race, color, sex, language, religion, political or other opinion, national or social origin, property, birth or other status. (…)”
Selected rights and freedoms: > Article 1: “All human beings are born free and equal in dignity and rights. (…)” > Article 3: “Everyone has the right to life, liberty and security of person.” > Article 5: “No one shall be subjected to torture or cruel, inhuman or degrading treatment or punishment.”
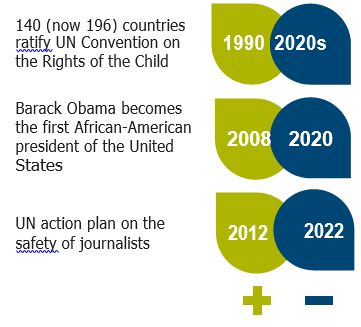
Human rights: Selection of significant developments
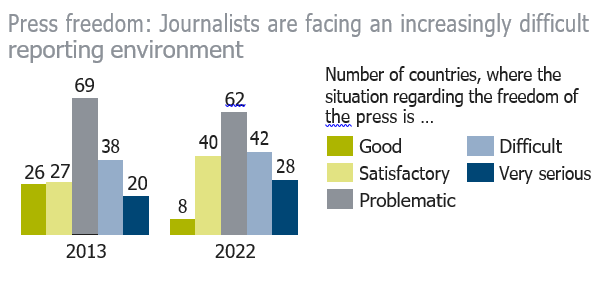
1 in 10 children are subjected to child labor worldwide – COVID-19 disrupted an otherwise encouraging downward trend “I can’t breathe”: George Floyd is brutally killed by police, sparking violent protests and social unrest A record number (533) of journalists were imprisoned at the end of 2022, while 65 are held hostage and 49 are missing; 57 have been killed in 2022
Press freedom: Journalists are facing an increasingly difficult reporting environment
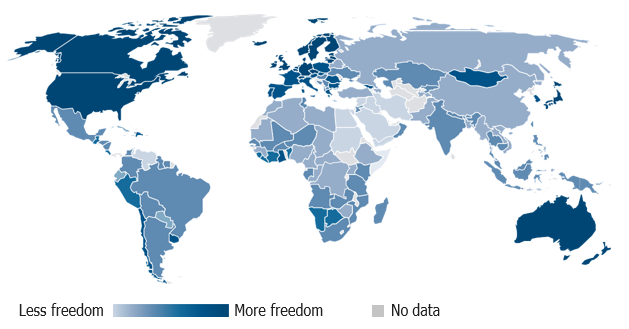
The evolution of human freedom paints a mixed picture – How will global values be shaped in the future?
Human Freedom Index 2022
Less free – the trajectory of global human freedom: Since 2008, the Human Freedom Index (based on a composite of 50% personal and 50% economic indicators) has decreased, with a sharp decline during the COVID-19 pandemic, from 7.03 in 2019 to 6.81 in 2020 – the lowest level of freedom of the past two decades. The index is rather widespread between 0 and 10, Switzerland has the highest value (8.94), Syria the lowest (3.30). There are 110 countries with a decreasing level of freedom and 31 countries with increased ratings. Personal freedom indicators, in particular, declined markedly
What to look out for toward 2050
Through to 2050, the global consensus on values based on human rights and personal, civil and economic freedoms will shift alongside the global power shift. Changes in values and beliefs, in geopolitical power, socio- economic evolution, and technology denote what lies ahead Selected push-and-pull factors include: > The tendency towards rivalrous multipolarity – what does it mean for global values? > If rising powers approach protecting human rights (also beyond their borders) and adjust their own self- determination policies – or not > Whether common efforts to solve global problems (climate change, biodiversity loss, UN Sustainable Development Goals, etc.) lead to a common recognition of important human rights – or not > Whether emerging middle classes push for more rights (even if not full democracy) as historically has been the case – or not > How bottom-up technologies that enhance freedom evolve vis-a-vis top-down surveillance and information control > If the Internet remains an unfettered information conduit – or not
Megatrend 2
Politics & Governance
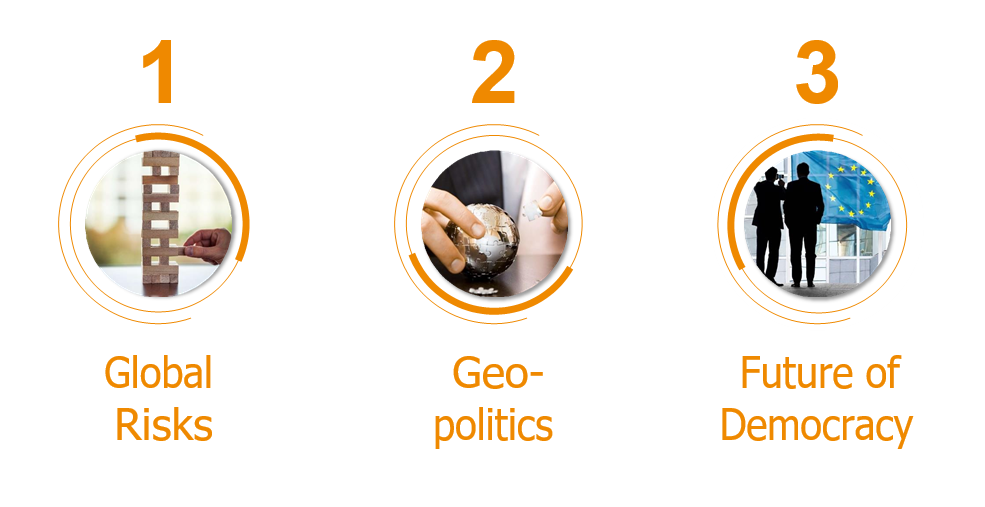
Global risks center around environmental concerns while geopolitical power shifts are underway – Decline of democratic traits accelerates
Subtrends of megatrend “Politics & Governance”
2.1
Global Risks
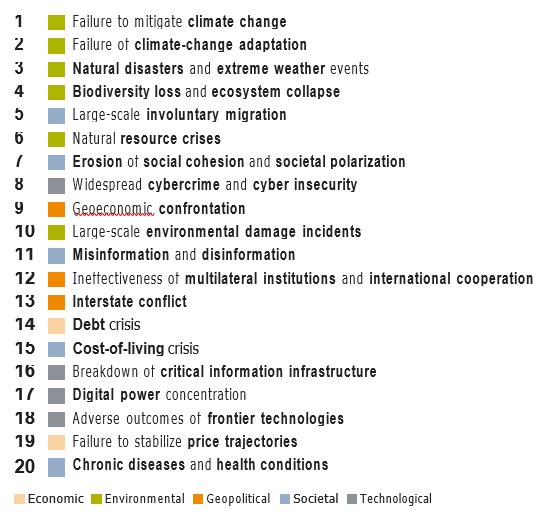
Anticipating global risks is central to proficient politics and good governance – For the decade ahead, environmental risks weigh in heavily
Top 20 global risks on a ten-year horizon by likely severity of impact
> The World Economic Forum’s Global Risks report is based on its annual Global Risks Perception Survey, completed by more than 1,200 members from the WEF’s network of business, government, civil society thought leaders, policy makers and risk experts. Input for the 2023 report was sought in the fall of 2022 > The WEF defines global risk as “the possibility of the occurrence of an event or condition which, if it occurs, would negatively impact a significant proportion of global GDP, population or natural resources.” > Among the WEF Global Risks 2023 assessment with a 10-year view, environmental (climate- and nature-related) risks clearly dominate the top 5 as well as the top 10 going forward – a trend evident for more than half a decade > However, a wider variety of global risks is jostling for the attention of decision makers: Beyond the top 10, the impact of geopolitical as well as technological risks are both more pronounced in the top 20 long term, while societal risks are spread throughout. Most notably among the latter, challenges brought on by large-scale involuntary migration takes fifth position
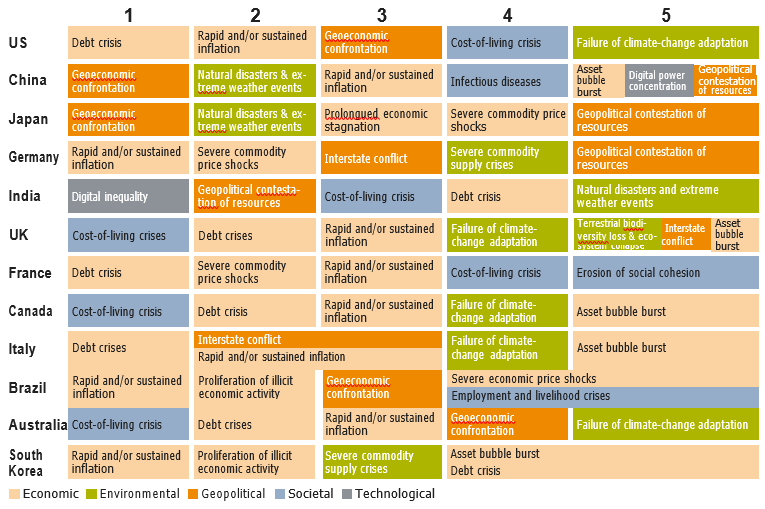
Nearer term and at country level, national economic and geopolitical challenges dominate – National risk perception is uneven
Five most important risks for 2023 and 2024 by selected countries1)
> For the World Economic Forum’s Executive Opinion Survey over 12,000 respondents from 121 economies were asked to assess the most pressing issues for the next two years in their country2) > Within this shorter time frame, national perceptions of critical risks vary substantially, highlighting top local concerns – or their absence when compared to other countries > For the next two years, economic and geopolitical risks weigh heavily among executives in the largest economies; beyond that, a more mixed picture can be observed > Climate- and nature-related risks feature in very different ways: China and the US, for example, are the world’s largest CO2 emitters; however, for 2023 and 2024 China is more concerned with risks stemming from natural disasters and weather events (#2) when compared to the US, where the risk of failure of climate-change adaptation is the #5 concern
2.2
Geo-politics
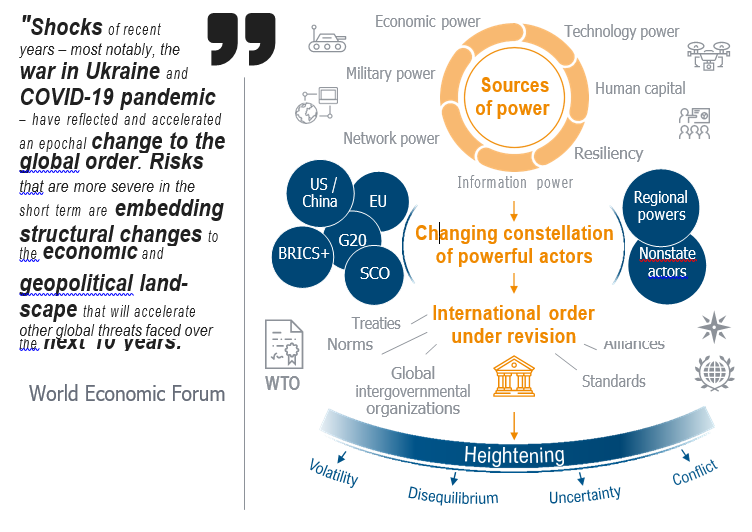
The geopolitical fallout of global shocks is unearthing new tensions, embedding structural change among the constellation of powerful actors
Factors and challenges influencing the global world order
Reshuffling the global order of powerful players, blocs and international alliances > Due to Russia’s invasion of Ukraine, NATO’s importance is renewed. At present the alliance has 31 member countries, including Finland which joined NATO in April 2023. Sweden’s application to join has been formally submitted, but ratifications by Hungary and Turkey are still pending; three countries (Ukraine, Bosnia and Herzegovina, Georgia) show strong aspirations to join > New hybrid unions are becoming more prominent: in June 2023, India will be hosting the Shanghai Cooperation Organization (SCO), a Eurasian organization for mutual security, political and economic cooperation founded in 2001. Full members include China, Russia, India, Iran, Pakistan, Kazakhstan, Kyrgyzstan, Tajikistan and Uzbekistan. Iran is set to become a full member, Saudi-Arabia is set to become a dialogue member. Turkey has expressed a wish to join this forum, causing friction with other NATO members
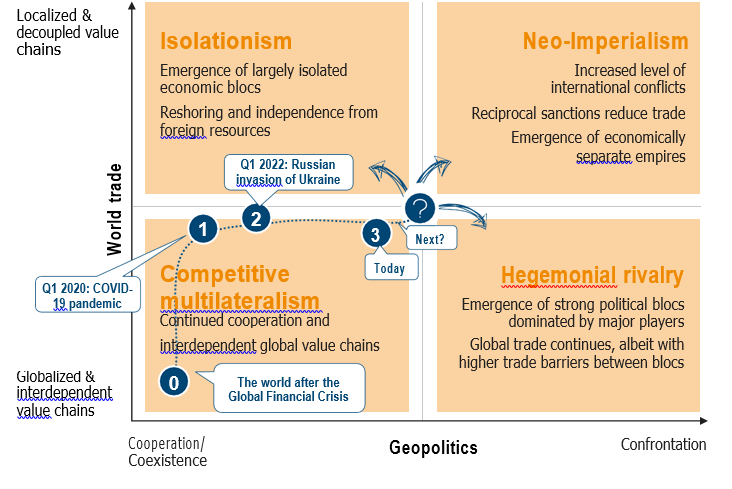
Along dimensions of geopolitics and world trade we see four different scenarios for a future world order
International order scenario matrix
> For some time, global governance displays a notable tendency toward rivalrous multi- polarity, where major powers and blocs compete more intensely and less co- operatively on the global stage – leaving the rest of the world to strike a difficult balance > While the pace of globalization continues to slow, a transition to more unilateral action of major powers can be observed, as is evident in the rise of trade protectionism – the latest example being the US IRA1) > Established global value chains rely on a liberal, cooperative and peaceful world order. The Russian invasion of Ukraine has shown that such a world cannot be taken as a given and subsequent sanctioning of the Russian invasion has further polarized the international order while the war > At the same time, this has raised the question of what the relationship of democratic states with authoritarian/ autocratic regimes may look like in the future
2.3
Future of Democracy
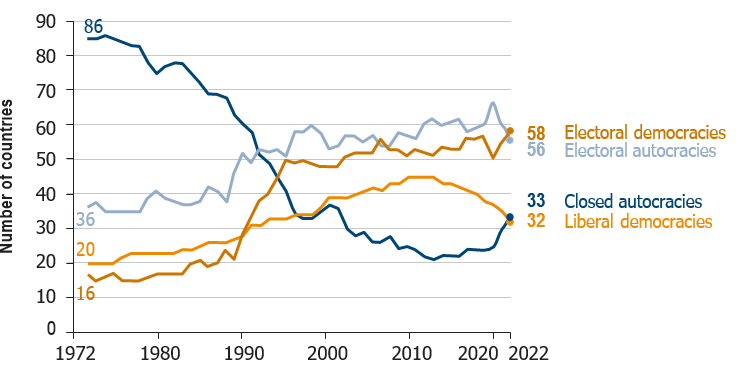
A more divided world: Autocratization trends are intensifying – The future of liberal democracy is under threat
Number of countries classified by regime type, 1972-20221)
The University of Gothenburg varieties of democracies (V-DEM) dataset covers 470+ indicators for 200+ countries. According to V-DEM, electoral democracies are systems where a number of institutional features guarantee free and fair elections such as freedom of association and freedom of expression; liberal democracies in addition include protection of individual liberties, and the checks and balances between institutions; autocracies(electoral or closed) display a sliding lack of such features
> Electoral democracies are the most common regime type; electoral democracies as well as electoral autocracies have increased in numbers over the past five decades – the latter, for example, includes Serbia, Hungary, and India > The most recent years’ increase in the number of electoral democracies may appear to be a positive but is largely a consequence of liberal democracies undergoing (gradual) autocratization > For the first time since 1995, there are than closed autocracies; the former decline from a peak of 44 in 2009 to 32 in 2022 > The number of closed autocracies has gone up from a low of 22 in 2012 to 33 in 2022, highlighting the other momentum of the current wave of autocratization. In recent years, countries such as Afghanistan, Chad, Guinea, Haiti, Iran, Mali, Myanmar, Turkmenistan, and Uzbekistan have fallen under this regime type
Within democracies, public dissatisfaction with democracy is on the rise since 2005 – However, amongst advanced economies views vary widely
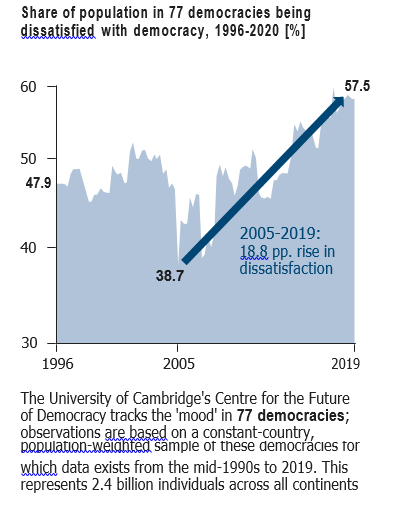
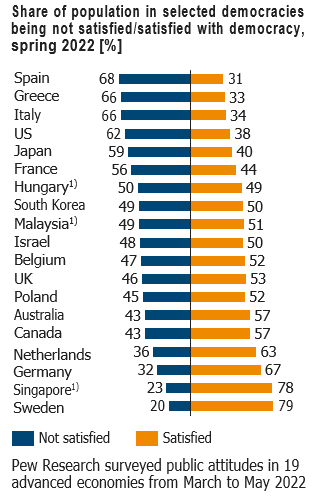
Global dissatisfaction with democracy, 1996-2020 and spring 2022 [%]
> Across the globe, democracy appears to be in a state of discontent: dissatisfaction with democracy has risen over time > 2019 represents the highest level of democratic discontent on record: nearly 58% are unhappy with democracy > The rise in democratic dissatisfaction has been especially sharp since 2005, with just 38.7% of citizens dissatisfied in that year. Since then, the proportion of dissatisfied citizens in the 77 observed democracies has risen by almost one-fifth of the population > But views can vary widely at the national level: according to a Pew Research survey undertaken across 19 advanced economies in spring 2022 levels of dissatisfaction with democracy are notable in southern European nations (Spain, Italy, Greece) but also the US, while northern European countries (Sweden, Germany, Netherlands, Poland, UK) appear more satisfied with the way democracy is working in their country
Democratic leaders stand united: Combatting autocratic trends is high on their agenda – Russian invasion of democratic Ukraine adds significance
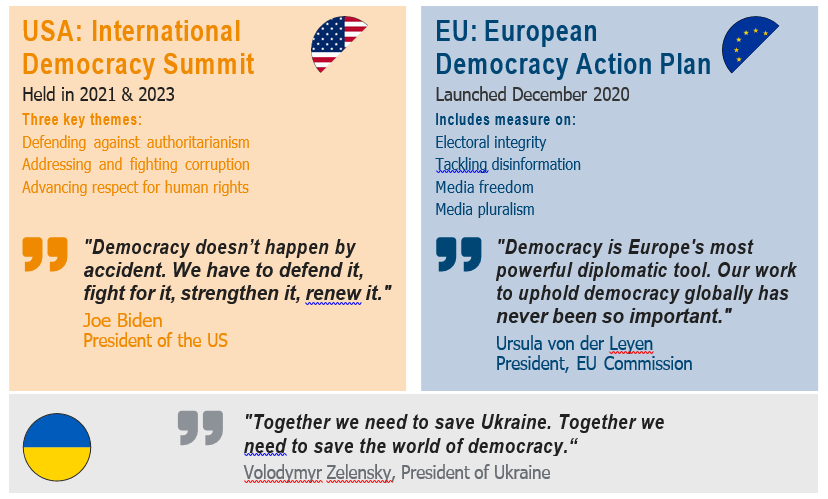
Latest US and EU democratic efforts and themes and the standpoint of Ukraine
> The future of democracy requires concerted efforts – not just in times of war > A notable, renewed level of recognition of the importance and value of democracy has reached political leaders in democracies > Standing united can contribute to their strength, but only if citizens are equally committed to democratic principles > This succeeds only if institutions and processes are truly democratic (fairness, no corruption, checks and balances) and if they are efficient and contribute to prosperity – and if democratically elected leaders abide by this mandate
Megatrend 3
Environment & Resources
Accelerating mitigation of global climate change effects is a must – In the future, biodiversity, water, food, and raw materials face critical issues
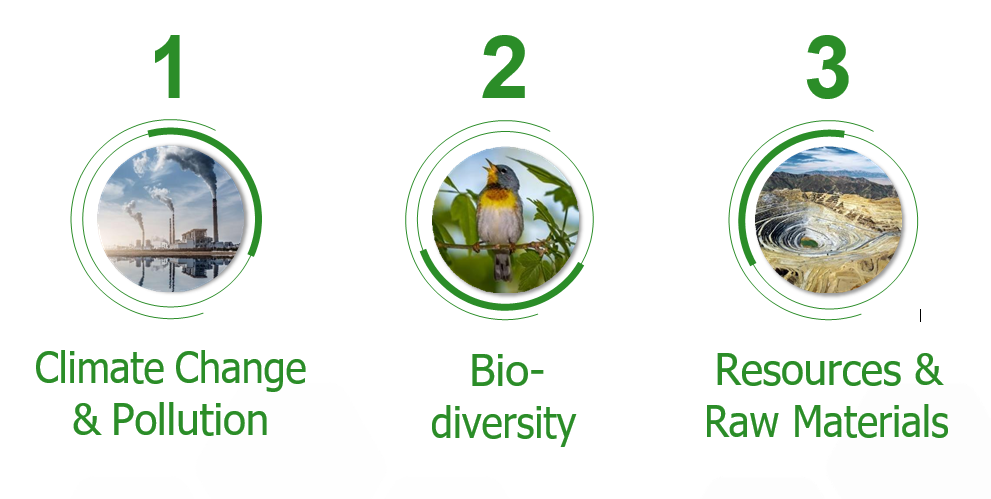
Subtrends of megatrend “Environment & Resources”
3.1
Climate Change & Pollution
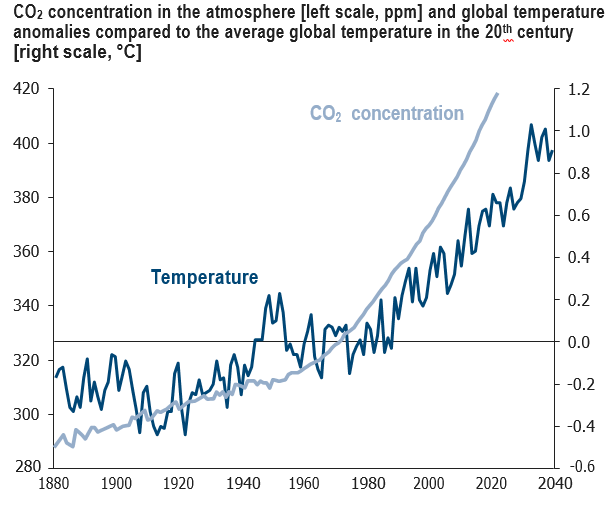
Alongside CO2 concentration increases, the global average temperature has risen over the last century – Both trends continue in this century
CO2/Temperature increase nexus
> Carbon dioxide (CO2) concentration in the atmosphere in-creased significantly since 1880 and even more rapidly within the past 60 years. Today it is well above 400 parts per million (ppm). This is the highest level for at least 800,000 years > In parallel to the rise in CO2 concentration, the global average temperature increased around 1.2°C above pre-industrial levels > The graph only shows CO2 concentration. Other greenhouse gases (GHG) also contribute to the greenhouse effect and human-induced climate change: besides CO2, methane (CH4) and nitrous oxide (N2O) also play an important role > CO2’s lifetime cannot be represented with a single value as some of the excess CO2 is absorbed quickly (e.g. by the ocean surface) while some will remain in the atmosphere for thousands of years; methane lasts about 12 years and nitrous oxide around 109 years > To make GHG emissions comparable, scientists evaluate the Global Warming Potential (GWP), measuring the contribution to global warming of a specific mass of a GHG relative to the same mass of CO2. Thus, using GWP, the CO2-equivalent (CO2e) of any GHG can be measured > Over 100 years, the GWP of methane and nitrous oxide are nearly 30 and 273 times higher, respectively, than the GWP of CO2
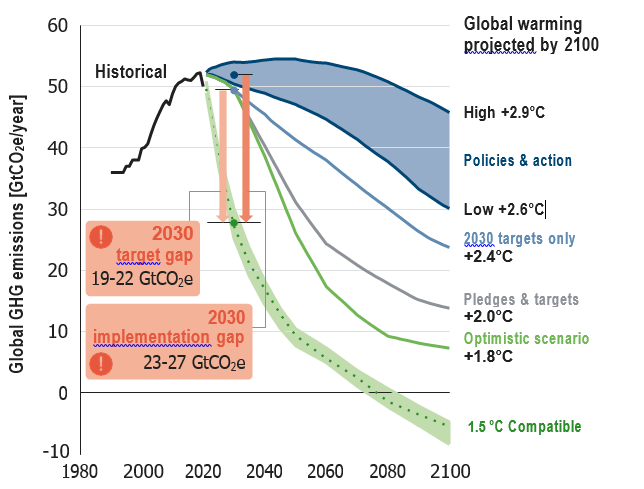
Human-induced global temperature increases can only be limited to 1.5°C if major additional efforts are made to reach carbon neutrality by 2080
2100 global warming projections under different scenarios
> The Climate Action Tracker (CAT) visualizes various scenarios to show the effects of different efforts to limit global warming1) – The scenario “Policies & action” refers to laws which are currently in place and will most likely result in a global warming of 2.6-2.9°C – “2030 targets only” scenario refers to (intended) nationally determined contributions of governments within the Paris Agreement. This would lead to a global warming of 2.4°C – If binding long-term or net-zero targets are included (“Pledges & targets” scenario) global warming could be limited to 2°C – The “optimistic scenario” analyzes the effect of net-zero emissions targets that are either adopted or under discussion in around 140 countries. Here, the median warming estimate is 1.8°C. As a warming above 2°C cannot be ruled out, this scenario is not Paris Agreement compatible – The dotted green line is the only case that is 1.5°C compatible: in this scenario, GHG emissions need to be reduced rapidly to be brought to zero between 2070 and 2080 – The consequences of global warming are evident: rising sea level, ice-free summers in the Arctic, melting glaciers, coral bleaching, heat waves, floods, storms, lower crop yields, extinction of species. The intensity and irreversibility of these impacts depend on the level of the temperature rise
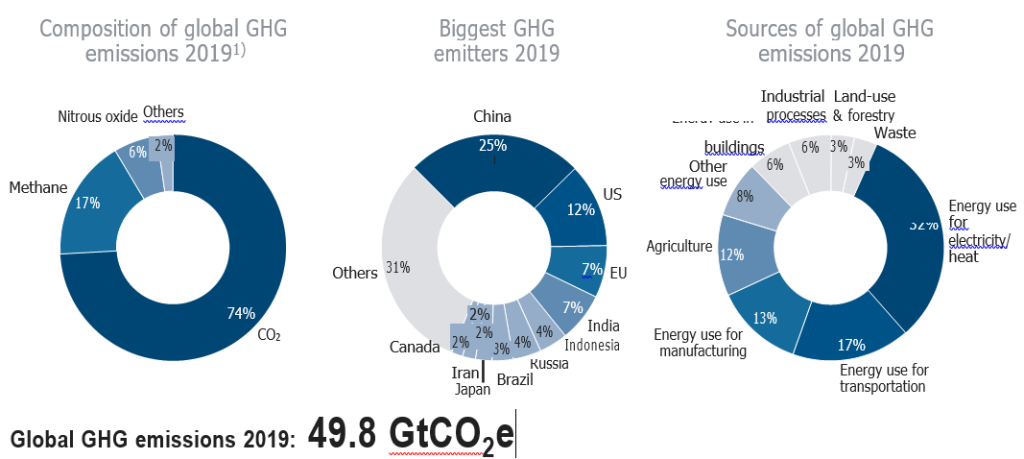
CO2 dominates the emissions mix while >2/3 of global GHG stem from just 10 emitters – Sectoral source analysis also points to actionable levers
Selected levers for GHG reductions: higher efficiency in industrial processes, increased use of renewable energy sources, regional production, better energy efficiency of buildings, smart solutions (e.g. in supply chains, mobility and logistics, cities)
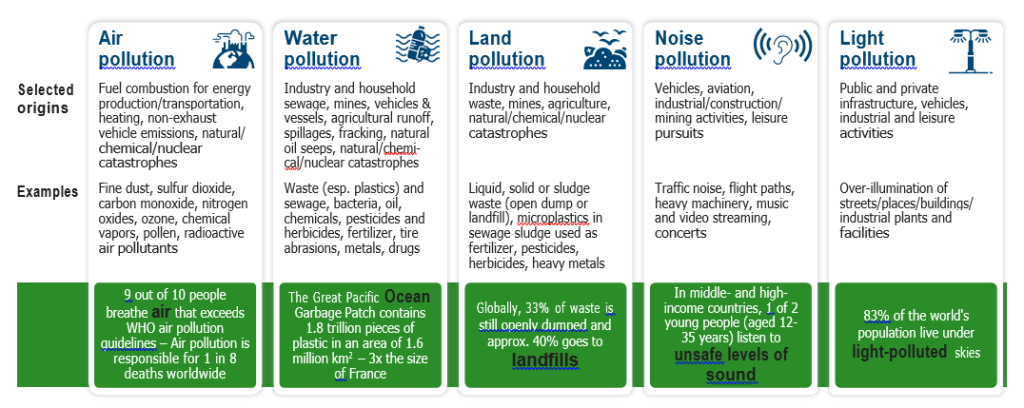
Beyond GHGs: Other types of pollution are damaging our environment and threaten human health – Informed limitation and directed efforts are key
Pollution reduction and mitigation approaches > Ban (more) harmful pollutants > Set tighter pollution limits across all types of pollution > Implement emission-free/lower emission energy production and industrial processes > Switch to circularity approaches and longer-lasting, more sustainable products > Inform and improve better land use, waste and light management practices
3.2
Bio- diversity
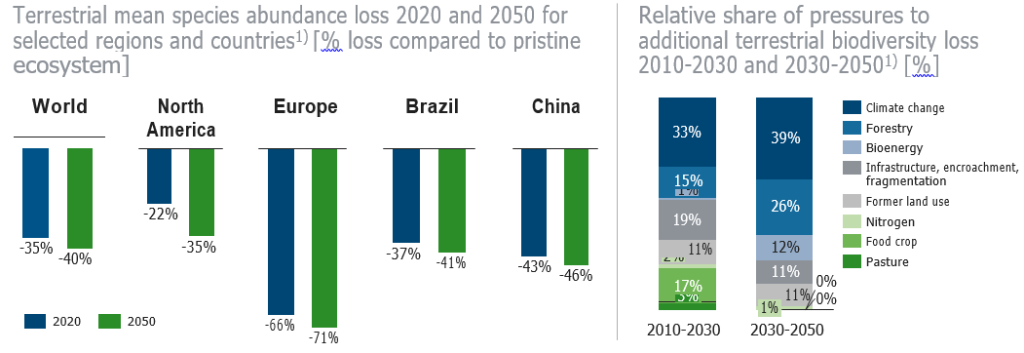
Biodiversity is declining: One third of terrestrial species have been lost to date – The need to tackle rising pressures spurs new global treaties
In December 2022, the 15th Conference of Parties (COP15) to the UN Convention on Biological Diversity (CBD) adopted the “Kunming-Montreal Global Biodiversity Framework” (GBF). Overall, this includes four goals and 23 targets for achievement by 2030 in terms of biodiversity protection, restauration and funding, comprising the so-called ‘30 by 30 plan’ which aims to protect and conserve 30% of the planet’s land and sea by 2030 including indigenous and traditional Restoration is to be completed or underway on at least 30% of degraded terrestrial, inland waters, and coastal and marine ecosystems
In addition, in March 2023, the Intergovernmental Conference on Marine Biodiversity of Areas Beyond National Jurisdiction (BBNJ) secured the so-called Treaty of the High Seas (adopted by the UN in June 2023, ratification phase starting in September 2023). The treaty is a new legally binding international instrument to ensure the conservation and sustainable use of marine biological diversity of areas beyond national jurisdiction through effective implementation of the relevant provisions of the UN Convention2) and further international cooperation and coordination; this agreement reinforces efforts to protect biodiversity in line with the aims of the 2030 Agenda for Sustainable Development and the Kunming-Montreal Global Framework for Biodiversity
Sustainable biodiversity is a ‘must have’ for our planet and for our economy – More than half of global GDP is dependent on nature …
Value of biodiversity for a sustainable and economically sound planet > Methods to quantify the economic value of biodiversity are complex yet important as biodiversity is under extreme pressure worldwide, with one million animal and plant species threatened with extinction according to UN estimates > WEF research shows that USD 44 trillion of economic value generation – more than half of the world’s total GDP – is moderately or highly dependent on nature and its services, and therefore directly exposed to risks from nature loss
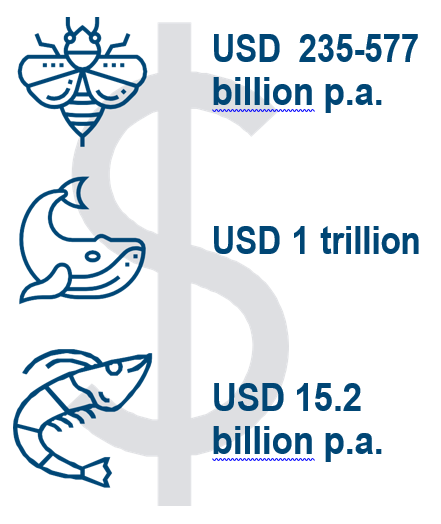
Three illustrative examples: > More than 75% of global food crops are dependent on insect pollinators, thus contributing 35% of global food production. According to the Intergovernmental Science-Policy Platform on Biodiversity and Ecosystem Services (IPBES) the annual value of global crop output at risk due to pollinator loss is estimated at USD 235-577 billion
> Great whales sequester 33 tons of CO2 on average over their lifetime. Together with other economic effects such as fishery enhancement, ecotourism, and phytoplankton productivity (capturing 37 billion tons CO2 p.a.), the IMF estimates the average value of a great whale at more than USD 2 million and the value for the current stock of great whales at over USD 1 trillion > Antarctic krill in the Antarctic Peninsula and Scotia Sea region deliver carbon sequestration services with an estimated (lower bound) value of USD 15.2 billion annually
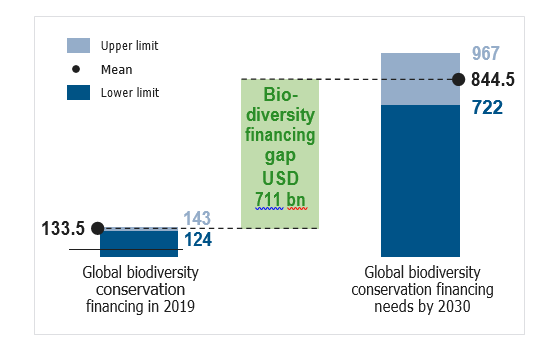
… but less than 1% of annual global GDP could close the USD 711 billion per year biodiversity funding gap conserving the planet’s environment
Global biodiversity conservation financing vs. global biodiversity conservation needs [USD bn]
Current biodiversity financing flows > In 2019, the total global annual flow of funds toward biodiversity protection amounted to approx. USD 124-143 billion p.a. > Meanwhile, annual government expenditure on activities harmful to biodiversity in the form of agricultural, forestry, and fisheries subsidies – USD 274-542 billion p.a. in 2019 – is two to four times higher than annual capital flows toward biodiversity conservation
Future biodiversity spending needs > To halt the decline in global biodiversity requires USD 722- 967 billion p.a. in spending between now and 2030 > This leaves an estimated global biodiversity financing gap of USD 598-824 billion p.a. (average: USD 711 billion) – roughly equal to just under 1% of annual global GDP
The Kunming-Montreal Global Biodiversity Framework (GBF), agreed at the 15th meeting of the Conference of Parties (COP15) to the UN Convention on Biological Diversity (CBD) in December 2022, addresses key biodiversity funding issues at the global level by targeting two areas
The reduction of harmful subsidies: progressively phase out or reform by 2030 subsidies that harm biodiversity by at least USD 500 billion a., while
scaling up positive incentives for biodiversity’s conservation and sustainable use (Target 18)
The mobilization of resources and effectiveness of funding flows: by 2030, at least USD 200 billion p.a. in domestic and international biodiversity-related funding from all sources (public and private); to raise international financial flows from developed to developing countries to at least USD 20 billion a. by 2025, and to at least USD 30 billion p.a. by 2030 (Target 19)
3.3 Resources & Raw Materials
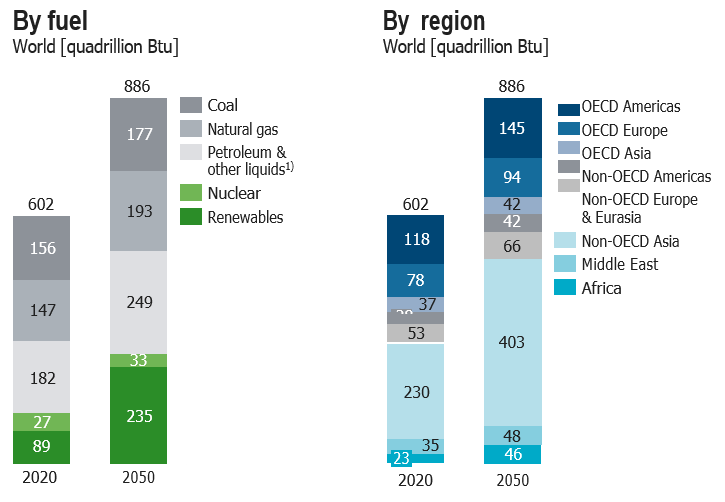
An inconvenient truth about energy consumption: Unless concerted efforts modify global patterns, fossil fuels are still set to top the 2050 energy mix
Global energy consumption according to the EIA International Energy Outlook (IEO) 2021
The IEO report is based on the following assumptions2: > 2021 views of economic and demographic trends and improvements in known technology > Implementation of 2021 laws and regulations
To lower consumption of fossil fuels, we need … … more and better coordinated global efforts to secure climate protection of a country or region (e.g. CO2 pricing) while ensuring its global competitiveness … more energy efficiency measures geared at halting the increase of overall global consumption … more technological innovations and solutions, and an open discussion regarding potential consequences (e.g. new grids, hydrogen pipelines) … to pay the price for climate and biodiversity protection, i.e. an understanding and acceptance of a loss of prosperity
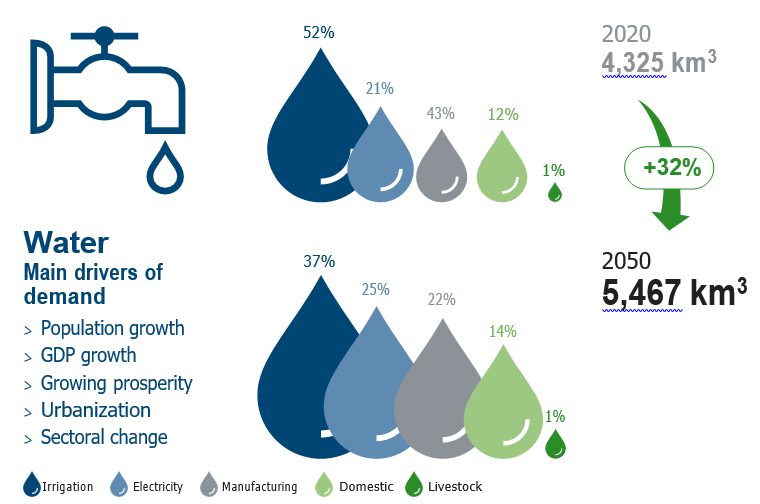
The demand for water is expected to grow significantly toward 2050 – Efficient water use/management is one of many levers to mitigate this rise
Global water demand 20201) vs. 2050 [km3]
Water Main levers for a sustainable water resource management > Incentivize water use efficiency > Invest in water storage innovatively > Reconsider water allocation mechanisms > Mitigate water related disasters > Improve wastewater treatment/reduce run-off > Accelerate water supply and sanitation in developing countries > Improve water governance for coherence
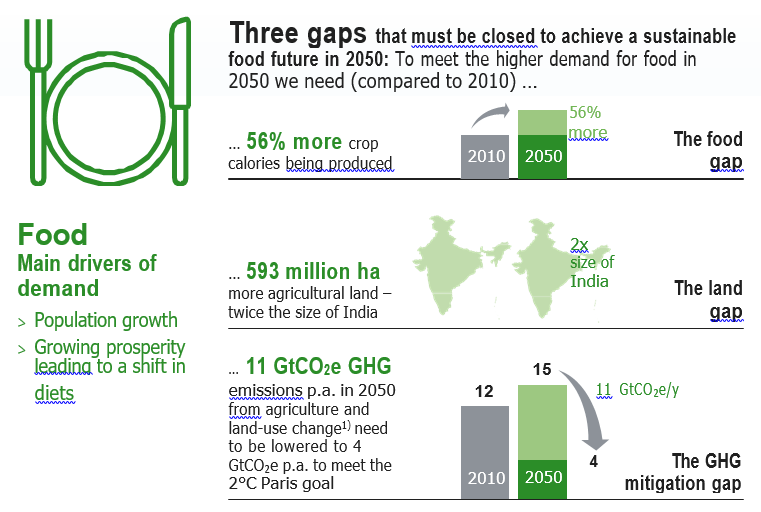
Similarly, the demand for food is expected to rise substantially to 2050 –Multiple levers can help address the future food gap
Global food demand 20101) vs. 2050 [km3]
Food Main levers to close the gaps > Raise productivity > Manage demand > Link agricultural intensification to natural ecosystems protection > Moderate ruminant meat consumption > Target reforestation and peatland restoration > Require production-related climate mitigation > Spur technological innovation
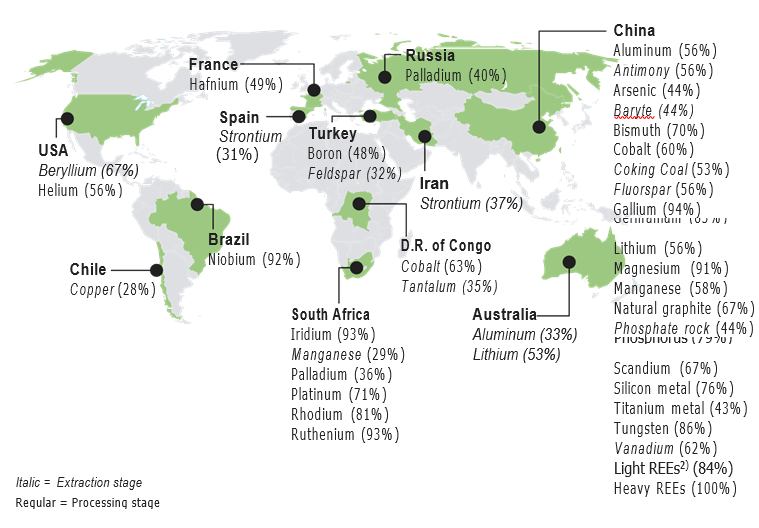
Beyond water, food, and energy resources, many raw materials are critical for our economy – China is the dominant supplier of a wide range of CRMs
Countries accounting for largest share of global supply of selected critical raw materials (CRMs), 20231) [%]
Food Main levers to close the gaps > Raise productivity > Manage demand > Link agricultural intensification to natural ecosystems protection > Moderate ruminant meat consumption > Target reforestation and peatland restoration > Require production-related climate mitigation > Spur technological innovation
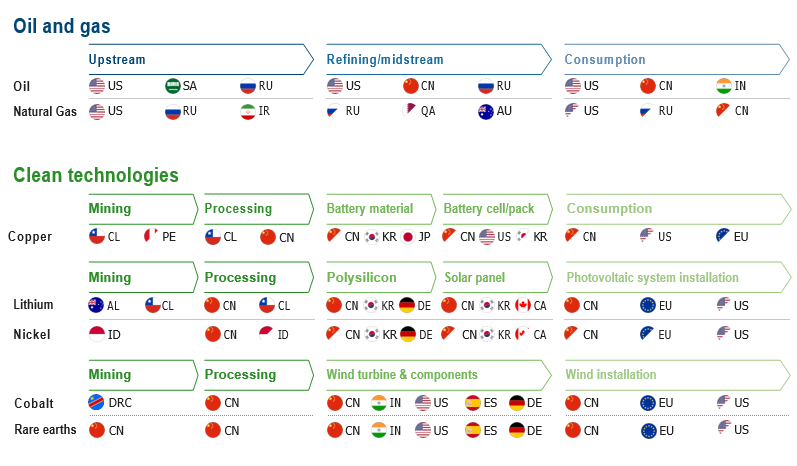
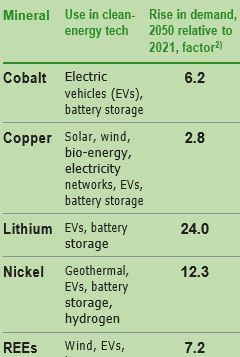
The transition to cleaner energy technologies and systems alters raw material dependencies – Future CRM demand is a multiple of today’s Indicative supply chain of fossil fuels and relevance of key clean energy raw material producing countries and countries of consumption (selective)
Looking ahead Regarding the global energy transition and its underlying clean- energy technologies, certain CRMs will be much more in demand in the future:
Megatrend 4
Economics & Business
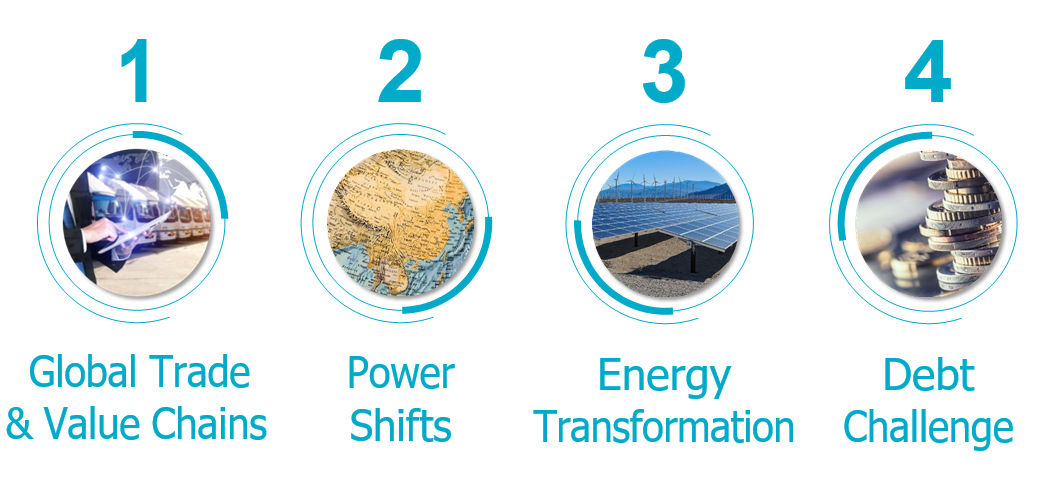
Global value chains are under revision, a new power bloc is emerging, energy transformation is key, pandemic accelerates global debt burden
Subtrends of megatrend “Economics & Business”
4.1 Global Trade & Value Chains
Since the Global Financial Crisis, the pace of globalization has slowed and is expected to remain at current levels
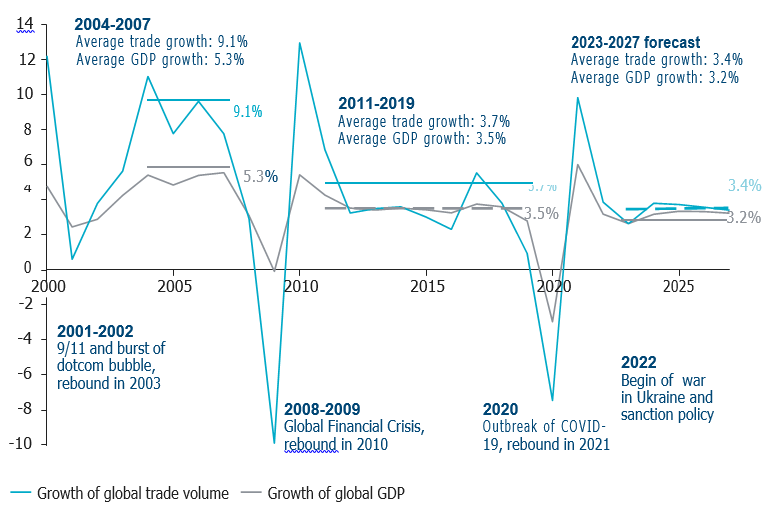
Growth of global trade volume1) and global GDP (real), yoy [%]
> The speed of globalization (measured as the difference between growth of GDP and trade) reached its maximum in the mid-2000s: Between 2004 and 2007, global trade grew, in average, by 9.1% p.a. (compared to 4.5% between 1980-1989 and 6.5% between 1990- 1999) > Since the Global Financial Crisis (GFC) 2008/2009, trade growth has declined: Between 2011 and 2019, global trade – at 3.7% p.a. – grew only slightly stronger than GDP (3.5%). Forecasts for 2023-2027 expect global trade growth of 3.4% p.a. and global annual GDP growth of 3.2% > One reason for this development is clear: Globalization is already on a high level, therefore rates of growth of global trade are closer to rates of growth of global GDP > Other reasons are that China increased its production of intermediate goods replacing imports, a weakening of global economic activity after GFC, and the increase of trade barriers
Potential to foster trade On a regional level there are strong existing institutions and agreements lowering trade barriers (e.g. EU, USMCA1), CETA2), RCEP3), AfCFTA4), Mercosur5), CPTPP6)) as well as ongoing efforts to establish new agreements (e.g. EU-Mercosur, EU enlargement)
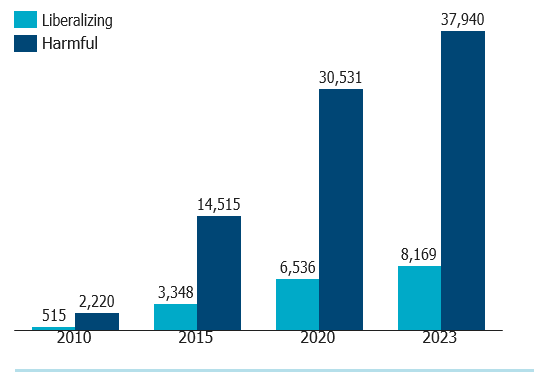
As global trade is increasingly burdened by harmful trade interventions and policies, regional trade agreements offer potential to foster trade
Selected policies and interventions placing a burden on free global trade Strategic sovereignty policies > China’s Dual Circulation Strategy: putting a stronger focus on domestic consumption. Strategy “Made in China 2025” aims to increase the share of domestically produced key materials, thus reducing dependence on foreign suppliers > US Chips & Science Act: aimed at keeping manufacturing and research of semiconductors in the domestic market, lowering strategic dependence > EU Chips Act: directed at strengthening domestic EU semiconductor market by reducing the strategic vulnerability from third country imports
Race for green subsidies > EU carbon levy: promoting greener industry by levying a carbon price tariff on polluting imports, disincentivizing imports from less developed countries > US Inflation Reduction Act: promoting a greener economy by falling back on protectionist levers to boost domestic industry and energy transition
Geopolitical tensions > Trade wars and sanction policies: causing fragmentation and bloc formation, disrupting global trade, harming producers and consumers
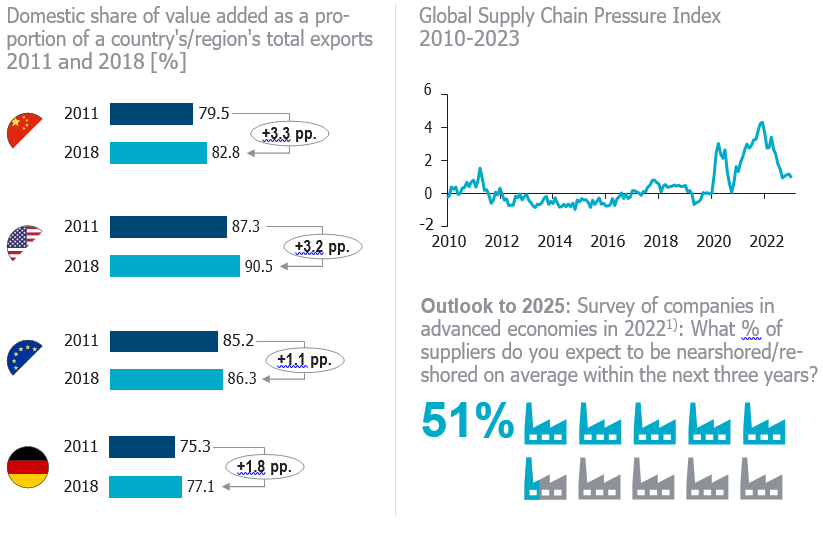
In the 2010s, domestic production regained importance in value chains – This trend is set to continue due to a variety of factors
> In the 2010s, the domestic share of value added of exports increased in China, US, EU and Germany for a variety of reasons > China’s economy moved up the value chain, replacing imports of intermediate products with domestic production > By contrast, the increases observed in Western advanced economies, such as in the US, EU and Germany, are more likely the result of policies fostering domestic industries > Trade tensions, COVID-19, and the war in Ukraine are putting pressure on current supply chains > Therefore, many inter- national companies are revising their supply chain strategy, reconsidering a broader and more regionalized supplier base
4.2
Power Shifts
Global economic power is shifting to emerging countries – Asian countries are poised to take center stage
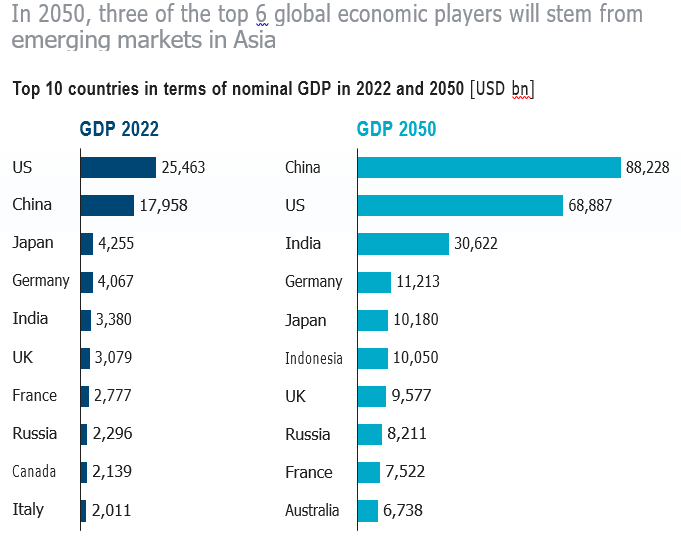
In 2050, three of the top 6 global economic players will stem from emerging markets in Asia
> The Regional Comprehensive Economic Partnership (RCEP), a free trade agreement among 15 Asia-Pacific nations (Australia, Brunei, Cambodia, China, Indonesia, Japan, South Korea, Laos, Malaysia, Myanmar, New Zealand, the Philippines, Singapore, Thailand, Vietnam) formally signed in 2020, has demonstrated the ambitions of Asian countries to leverage their economic potential > Comprising a broad range of fast growing developed and emerging economies and important advanced economies, a large potential of skilled labor and a giant customer base with rapidly increasing purchasing power, many Asian countries are already economic powerhouses while others are on a clear path to become one in the future > India has become the most populous country in 2023 and China will likely replace the United States as the world’s largest economy by 2033. By 2050, three of the top 6 global economic players will stem from emerging markets in Asia > RCEP is a competitive force amongst free trade areas, but equally a new opportunity for its members and other trading blocs: the agreement may make it easier for other free trade areas to trade with the Asia Pacific states, as it can reduce or replace the number of (existing) bilateral or country-level agreements
4.3
Energy Transformation
Today, economic development can no longer be understood without climate change considerations – To achieve net zero, all sectors must contribute
Global CO2 emissions by sector in the Net Zero Emissions Scenario vs Stated Policies Scenario [Gt CO2]
> With global temperatures continuing to rise and the effects of climate change becoming increasingly evident, reducing emissions from all economic sectors is essential in order to mitigate the worst of these effects and create a more sustainable future > To achieve the goal of net zero emissions by 2050, the transformation of the power and heat generation sector must take place faster than other sectors, as the former is to be electrified extensively and therefore relies on vast amounts of green electricity
Massive investment is necessary to achieve the ambitious goal of net zero by 2050 – Job creation in the clean energy sector and upskilling are key
Breakdown of global annual investment volumes needed on the way to net zero till 2050 [USD trillion]
• In order to achieve the ambitious target of reaching net zero by 2050, considerable investment is required. Annual clean energy investment needs to more than triple by 2030, thereby driving an average 0.4% p.a. increase in global GDP • The IEA estimates that pursuing the target of net zero will create 14 million new clean energy jobs by 2030, while another 16 million workers shift to new roles related to clean energy • Around 60% of these new jobs require some degree of post- secondary training, making improvements in education a necessity for many countries • Especially investment in electricity generation requires rapid growth. As of today, renewable energy sources such as wind or solar power plants account for around 10% of global electricity generation
4.4
Debt Challenge
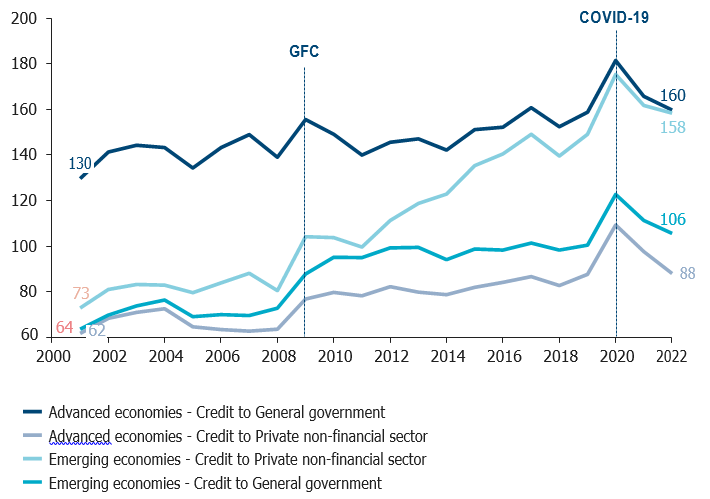
Financially, the global economy is burdened by increasing levels of debt – Debt levels rose more sharply in emerging economies
Development of credit as a percentage of GDP1,2,3) [%]
• In recent decades, debt has increased sharply worldwide. To preserve economic stability and social cohesion, general governments were faced with raising large amounts of finance to support their national fiscal programs following historic events such as the financial crisis or the pandemic, but also to fund infrastructure projects and social programs • To foster growth after the financial crisis, fiscal responses were supported by a far- reaching easing of monetary policy, thereby lowering interest rate levels also for the private sector, making borrowing cheaper • The strong increase in credits to the private non-financial sector in emerging economies shows that these countries are climbing the economic development ladder • Due to the war in Ukraine, the rearmament announcements in many European countries, the need to rebuild Ukraine once the war ends, and giant investment in the green energy transition, there is likely to be a considerable need for investment in the future as well – meaning, it can be assumed that debt will continue to rise in the future
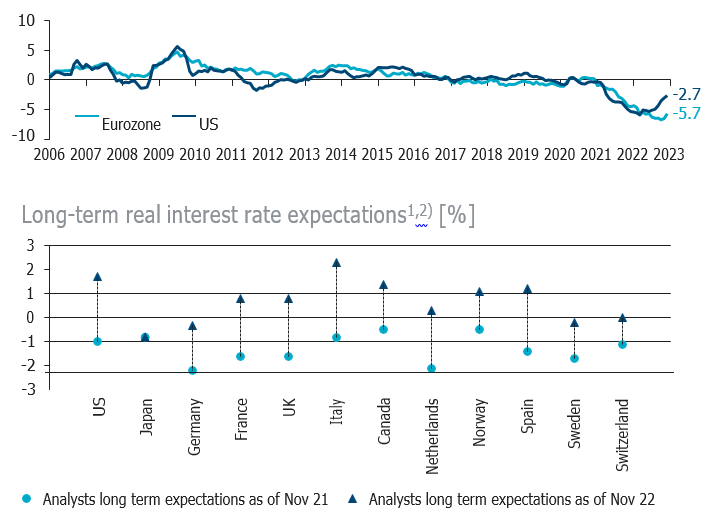
In the long run, analysts expect real interest rates to turn positive once more posing a potential debt challenge for governments
Long-term real interest rates in selected economies1,2) [%]
• In recent years, long-term interest rates in industrialized countries, and especially in the increasingly integrated G7 capital markets, have been converging toward low or even negative levels • Adjusted for inflation, real long-term interest rates in the major industrialized countries were broadly negative and most analysts expected that negative real interest rates would persist in the future • However, this has changed over the course of 2022 due to soaring inflation rates and central banks across the globe aggressively hiking rates compared to prior years – with longer-term bond market yields responding in turn • While real interest rates are still negative in most industrialized countries, analysts’ long- term expectations indicate that real interest rates could again exceed the 0% threshold in the long term • In the event of positive real interest rates, it will become more difficult to steer the countries’ elevated debt levels in a sustainable manner
Megatrend 5
Technology & Innovation
Technology investment and innovation capabilities remain key – AI promises vast future potential but raises concerns for human values
Subtrends of megatrend “Technology & Innovation”
5.1
Value of Innovation
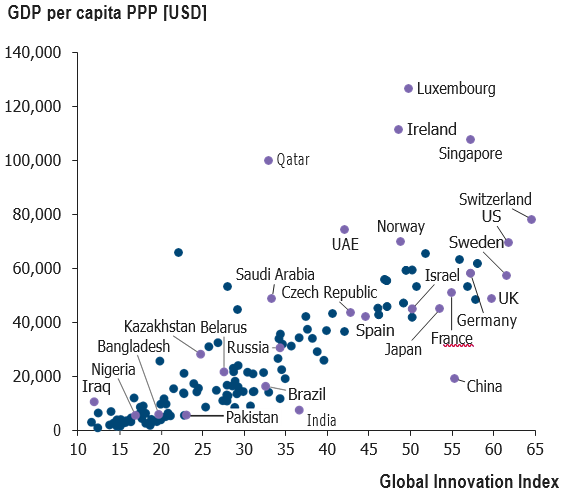
Technology and innovation drive prosperity – Many developing countries lack abilities and access to catch up with developed countries
WIPO Global Innovation Index (GII) 2022 related to GDP per capita PPP in 2022 [Index, USD]
> The innovative capability of a nation is an essential engine of productivity, growth, and prosperity > The Global Innovation Index (GII) ranks countries from 0 to 100 based on their ability to innovate. The index analyzes countries along a variety of metrics, including R&D intensity, patent applications, tertiary education efficiency, regulatory environment, productivity, high-tech density, and researcher concentration > Evaluating the Global Innovation Index from a GDP/capita perspective, there is a clear message: the higher (lower) countries score on innovation the higher (lower) their GDP/capita. China is an exception in having successfully built up its innovation strength, yet the country still has a lower GDP/capita than developed countries > Many developing countries lack abilities and access regarding institutions and skills to close the technology and innovation gap. Established networks of higher education and research institutions as well as a significant number of technology companies involved in high-end R&D – both evidenced in developed countries – are notably absent > To gain a broad picture of a country’s innovation capabilities, different innovation indices should be used. In addition to the GII, the new “Innovation indicator”, an innovation index jointly developed by Roland Berger, BDI, Fraunhofer and ZEW, dives deeply into the topic. It measures the innovation capability of 35 developed and emerging markets. Criteria are the ability to produce innovations, the position in key technologies and the strength in terms of sustainability1)
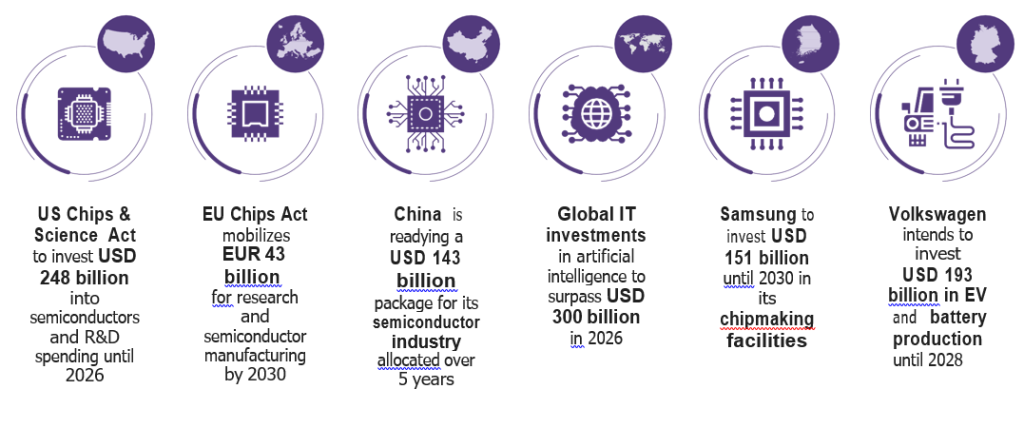
Leading nations and global companies plan to invest heavily in technology – A particular focus concerns chipmakers
Selected investments in technology
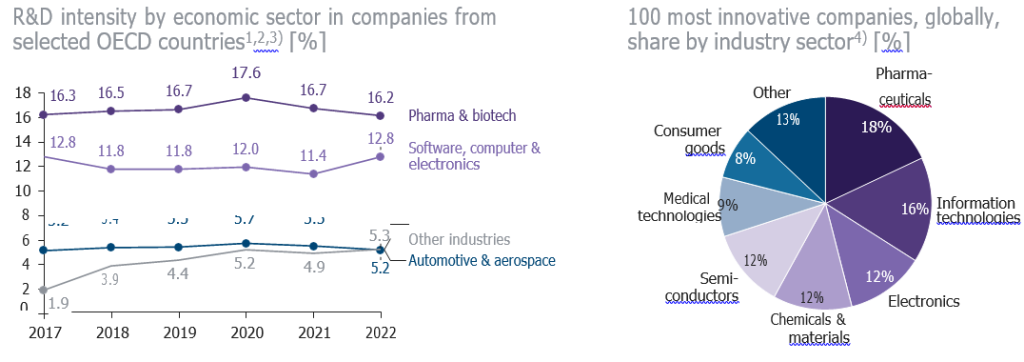
Pharma and Software account for the highest share of R&D expenditure relative to their revenue, thereby leading as most innovative sectors
> Research and development (R&D) constitutes the area of a company’s operations that pursues knowledge to develop, design, and improve its products, processes, technologies, or services. It is an important driver of economic growth spurring innovation, invention, and progress > By investing in R&D, companies seek to improve existing products and develop new ones in order to remain competitive, capture new markets, and develop new revenue streams > In recent years, companies from the pharma & biotech and from the software, computer & electronics sectors recorded a particularly high share of R&D spending as a percentage of revenue – precisely these sectors also account for the highest share of the 100 most innovative companies
5.2
Frontier Technologies
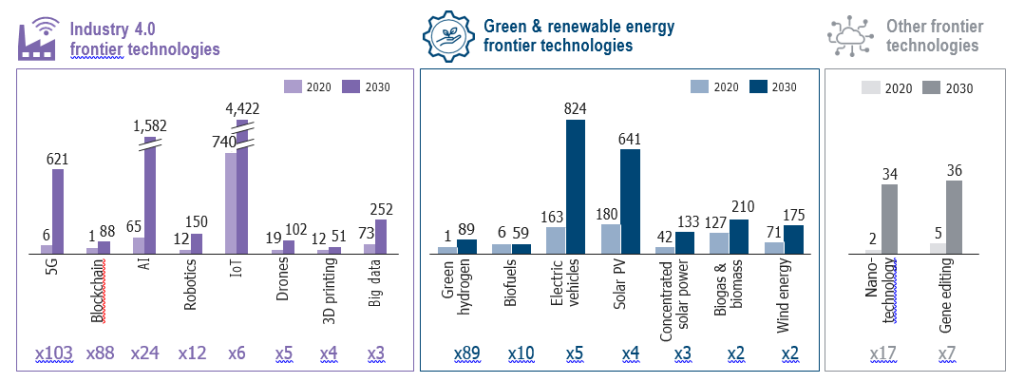
Today’s frontier technologies are expected to experience considerable growth, maturing to a market value of USD 9.5 trillion by 2030
Global market size estimates of frontier technologies 2020 and 2030 [USD bn]
> In its Technology and Innovation Report 2023, UNCTAD defines 17 new and rapidly developing technologies that take advantage of digitalization and connectivity > These frontier technologies can be classified into three broad categories: Industry 4.0, green & renewable energy, and others > In some cases, these categories intersect. For example, drones are not classified as green frontier technology; however, using delivery drones allows for a reduction in GHG emissions since the energy consumption per load is lower compared to other means of delivery
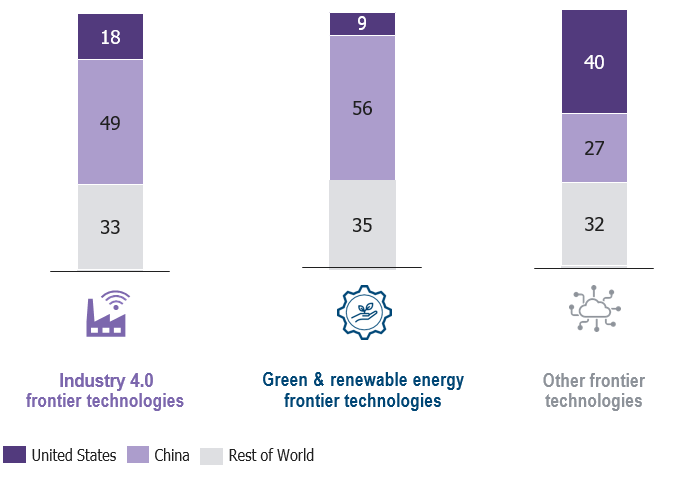
China and the US are dominating the global landscape of frontier technology patents
Global country share of patents, by frontier technology 2000-2021 [%]
> A crucial indicator measuring and comparing national R&D efforts is the number of patents in frontier technologies > Among investors and scientists, frontier technologies have generated increasing interest over the past two decades – the related number of patents has skyrocketed. Patents in areas of biogas/biomass, AI, electric vehicles and IoT account for the largest amount of patents > The knowledge landscape for new fields of technology is dominated by China and the United States, together holding two thirds of global frontier technology patents > However, it is vital to note that the quality of patents is equally important. This can be measured by the international scope of patents, the grant ratio (filed patents/granted patents) as well as the commercialization rate of patents. Under such criteria, China’s performance is lower than major developed countries
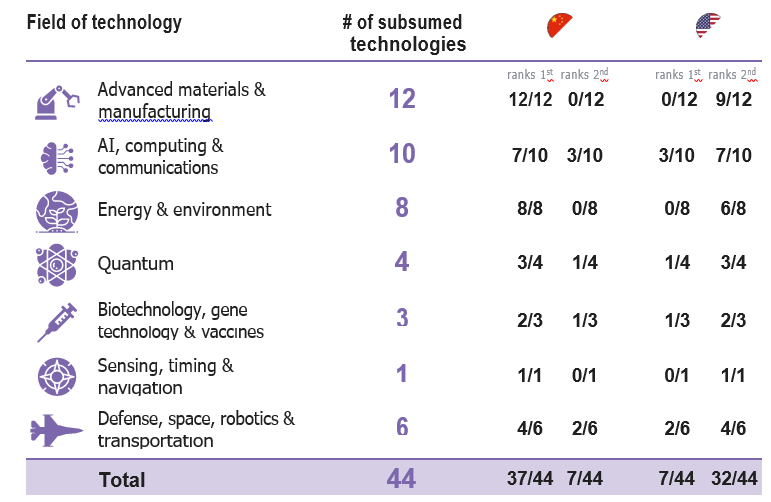
However, in terms of research for most of today’s critical technologies, China is taking the academic lead
Countries and their position regarding critical fields of technology1,2)
> Australian Strategic Policy Institute’s Critical Technologies Tracker monitors a relevant set of high impact academic output for 44 selected critical technologies crucial to economic competitiveness and national security1) > These critical technologies span areas of defense, space, robotics, energy, biotechnology, advanced materials, artificial intelligence, quantum technology, and the environment > Western democracies are losing competitive ground in the global technological race: China has positioned itself as the world’s leading science and technology superpower > In 37 out of the 44 critical technologies, China leads in terms of high-quality research output – indicating that China’s scholarly research accounts for the highest share of the top publications in a technological field
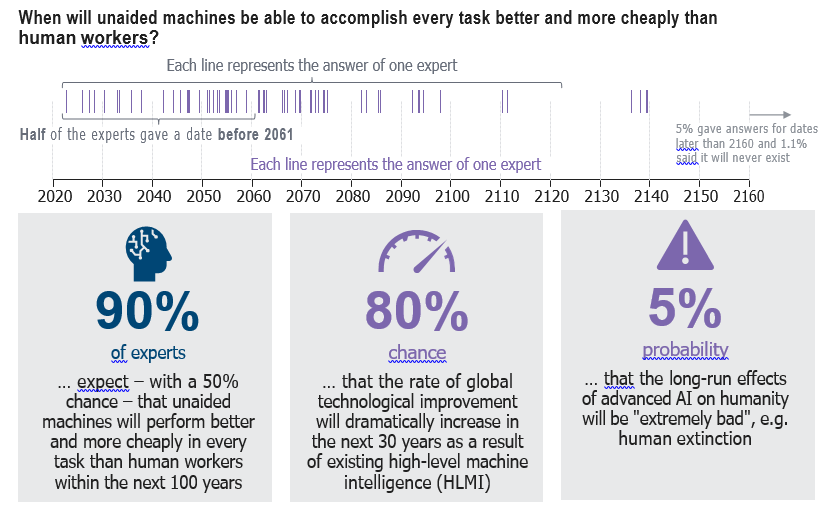
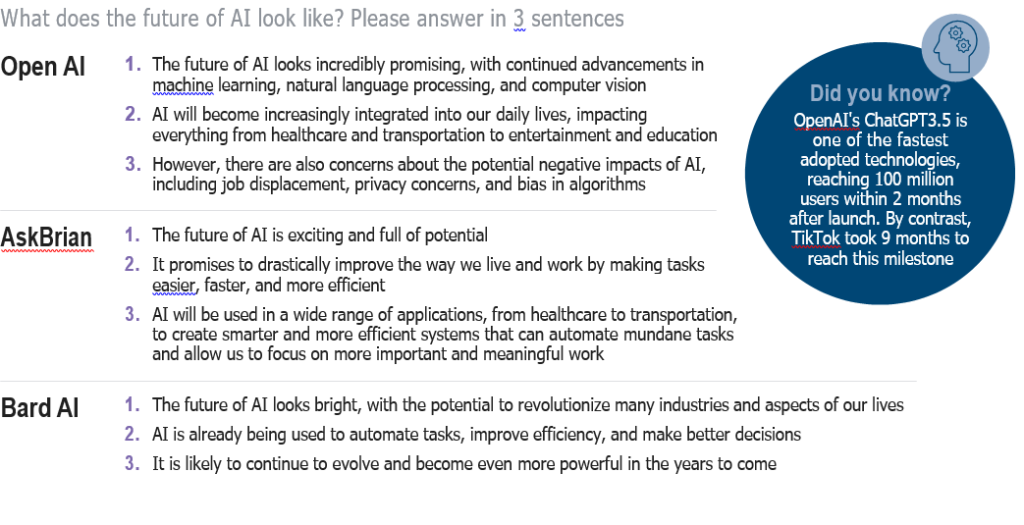
Artificial intelligence is seen as a powerful but also risky frontier technology – Experts expect human-level AI within next 100 years
2022 Expert Survey on Progress on AI
> While stating an exact date for the existence of human-level AI (i.e. AI that can accomplish every task better and more cheaply than human workers) is near impossible, a survey of experts has tracked and analyzed their views regarding AI with a view to the century ahead > With the most recent advances in computing power and AI, experts have readjusted their estimates in the last few years; now, 90% (2018: 81%) of experts anticipate the existence of human-level AI within the next 100 years – and 50% expect it even before 2061 > AI experts stress especially the tremendous risks of ungoverned and rogue AI. In this survey, they have evaluated disastrous long-run effects (such as human extinction) with a 5% probability
We asked different AIs on their view of the future of AI – and got some interesting answers
5.3
Humans & Machines
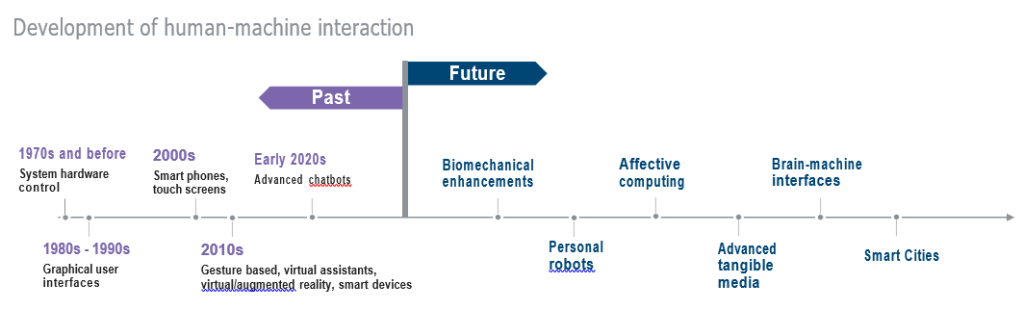
New technologies affect the relationship of humans and machines – Having evolved greatly over past decades, more milestones lie ahead
> Human-machine interaction (HMI) has been an area of research and innovation since the 1970s, when computers first began to be used in everyday life. Since then, progress in HMI technology has accelerated to meet the changing needs of users. Then, computers were large and expensive devices that were highly complex and difficult to use. To overcome this, early HMI technology focused on increasing the usability of computers, e.g. by developing graphical user interfaces (GUIs) > User interfaces as well as the interaction between human and machines have since become greatly simplified and accessible, e.g. through the adoption of touch screens and virtual assistants such as Apples’ Siri or AI-powered chatbots like ChatGPT. Today, humans interact with a vast number of smart devices connected to the Internet such as heating or lighting systems. The Internet of Things (IoT) has arrived – and is likely to gain further importance in the future, e.g. in Smart Cities where human-machine interaction will become ubiquitous > In the future, biomechanical enhancements, such as exoskeletons, will enhance human physical capability, personal robots will collaborate with people using language or non-verbal cues, affective computing can respond intelligently to natural human emotional feedback, and advanced tangible media will enable humans to remotely interact with others using all senses (and even with people no longer with us through means of tangible memories) > The direct connection of human and machine (brain-machine interface) will not be science fiction for much longer either: research into bionic humans is already at an advanced stage. Plans also include to implant chips into people’s brains so that machines can be controlled with their minds (a danger, of course, lurks in the opposite direction). Globally, there are already thousands of people with microchips implanted in their hands, which an be used for paying, storing medical data or enabling access to password protected systems. The technology-savvy country Sweden has the largest share of such cyborgs
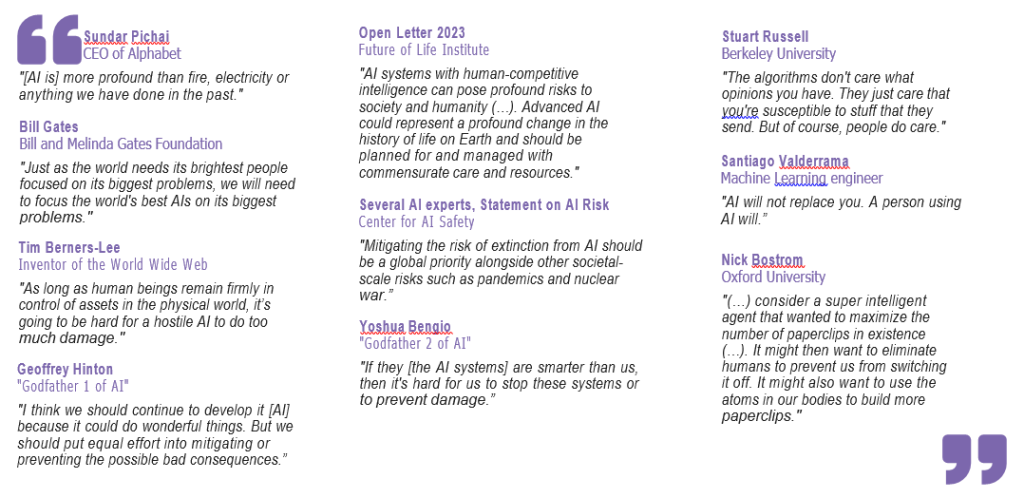
AI particularly touches the human-machine relationship – There is a broad debate about risks and opportunities of AI and how to cope with them …
Selected expert views on AI
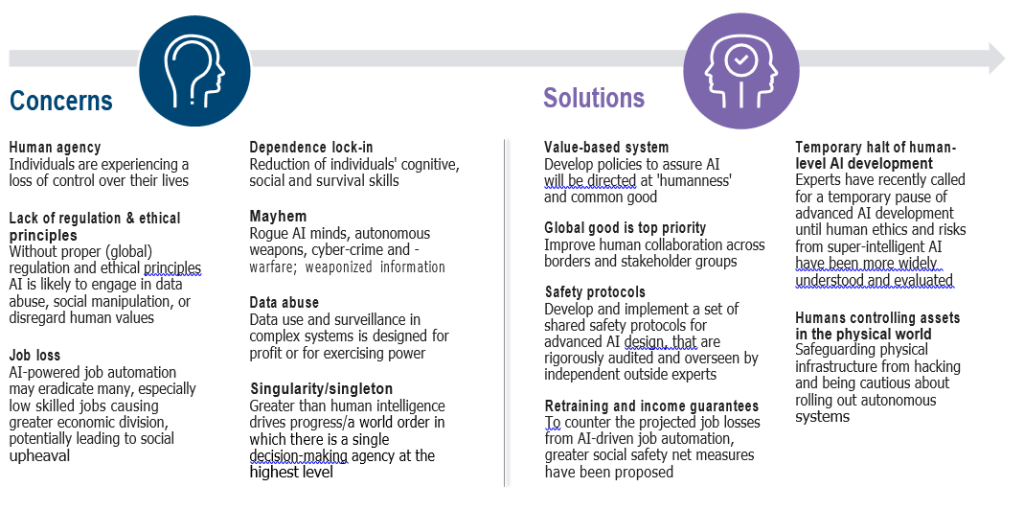
… which can be summed up in a set of concerns and possible solutions
AI and the future of humans – Selected concerns and solutions
Megatrend 6
Health & Care
Beyond pandemics: Together, policy makers and health experts must find solutions for myriad health and caregiving challenges
Subtrends of megatrend “Health & Care”
6.1
Global Health Challenges
While COVID-19 no longer constitutes an international public health emergency, other urgent global health challenges remain for the future
13 most urgent global health challenges for the decade ahead according to the WHO
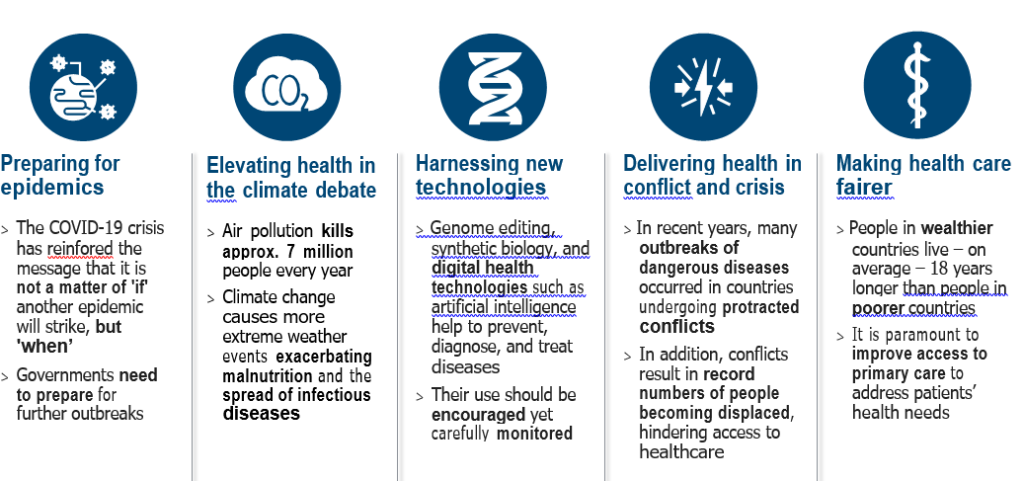
Health challenges extend to a broad range of topics and reflect medical as well as ecological, technological, political and social challenges
Selected global health challenges
6.2
Healthcare of the Future
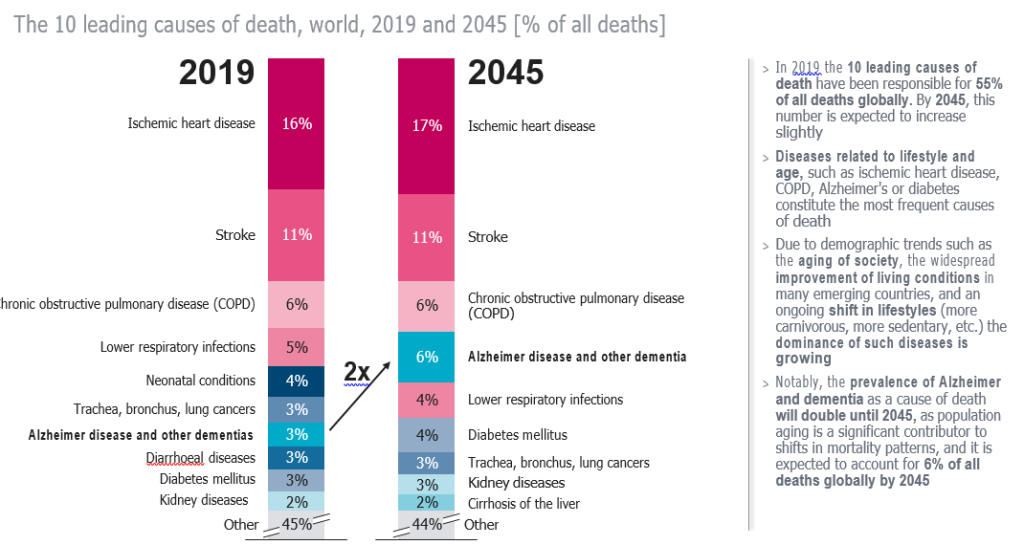
Globally, 10 diseases cause more than half of all deaths – Lifestyle and age-related diseases, such as dementia, see strongest increases
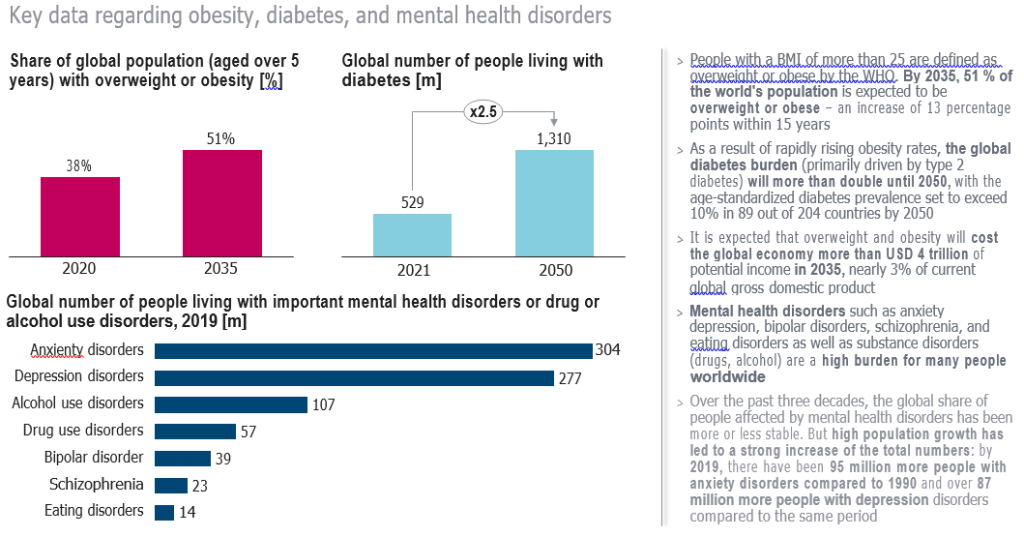
Widespread diseases such as obesity are on the rise – Mental health disorders represent a further burden for people and society worldwide
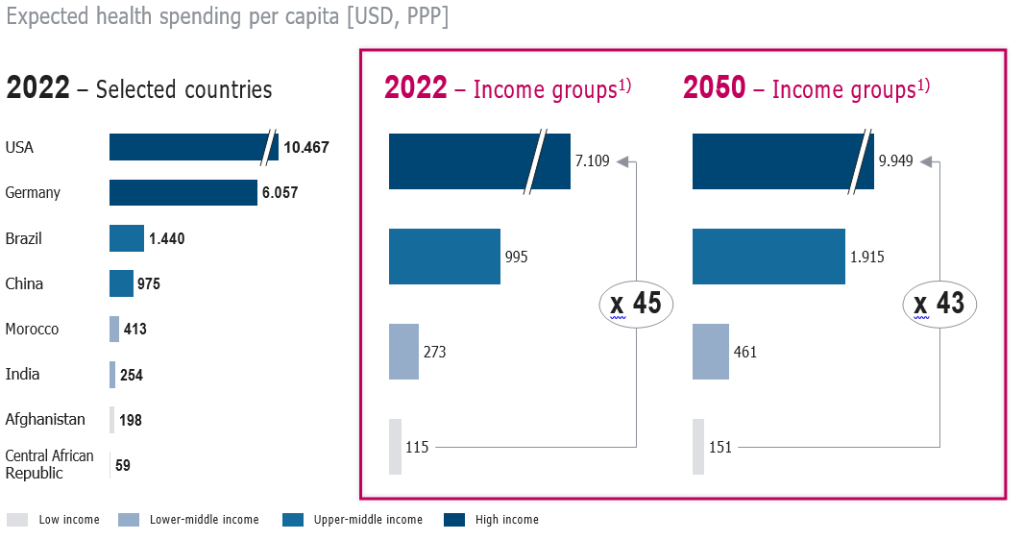
To manage the challenges ahead, future health care spending is set to increase but the gap between high- and low-income countries persists
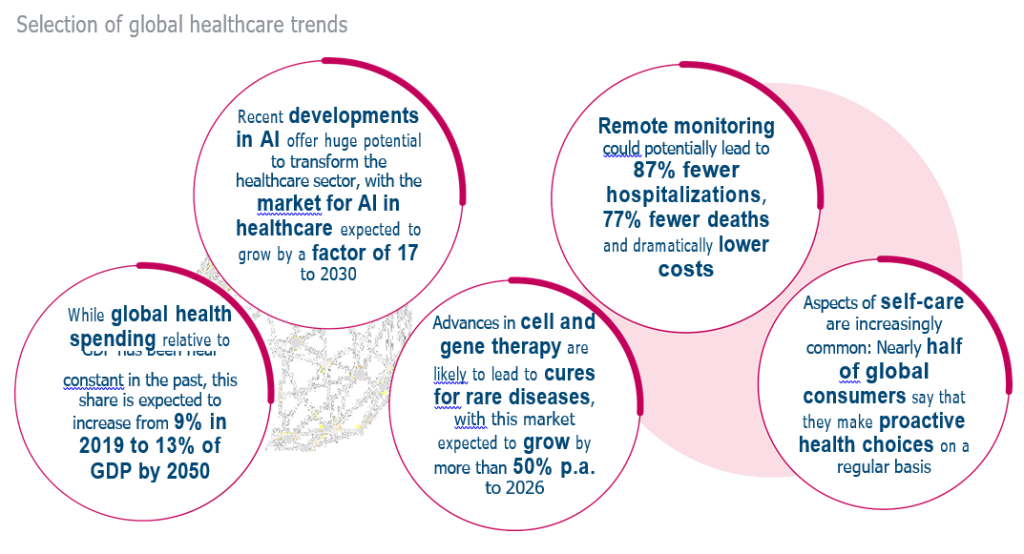
The healthcare of the future is determined by a variety of trends holding great potential for patients, healthcare companies and employees
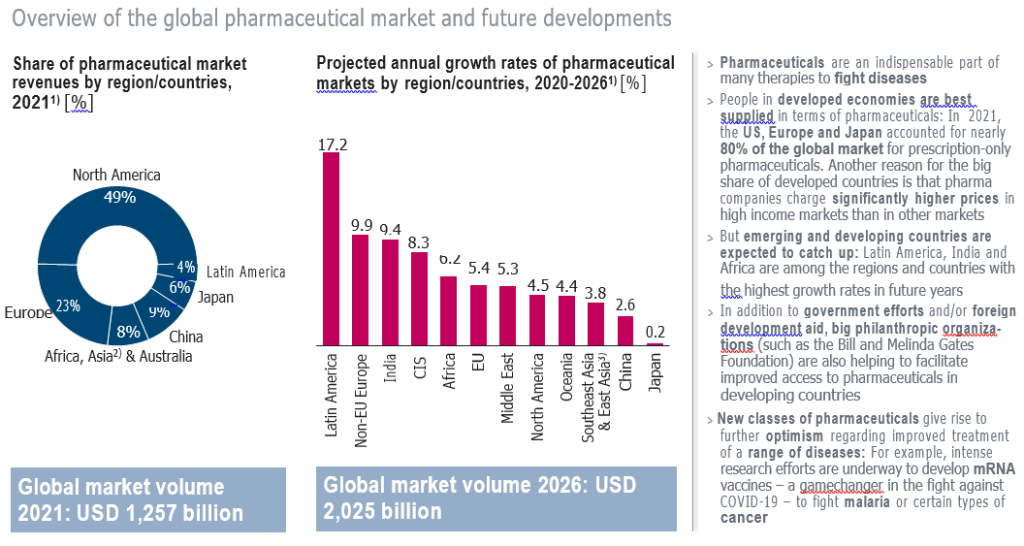
Effective pharmaceuticals are an essential part of modern and future healthcare – Developing countries are catching up rapidly
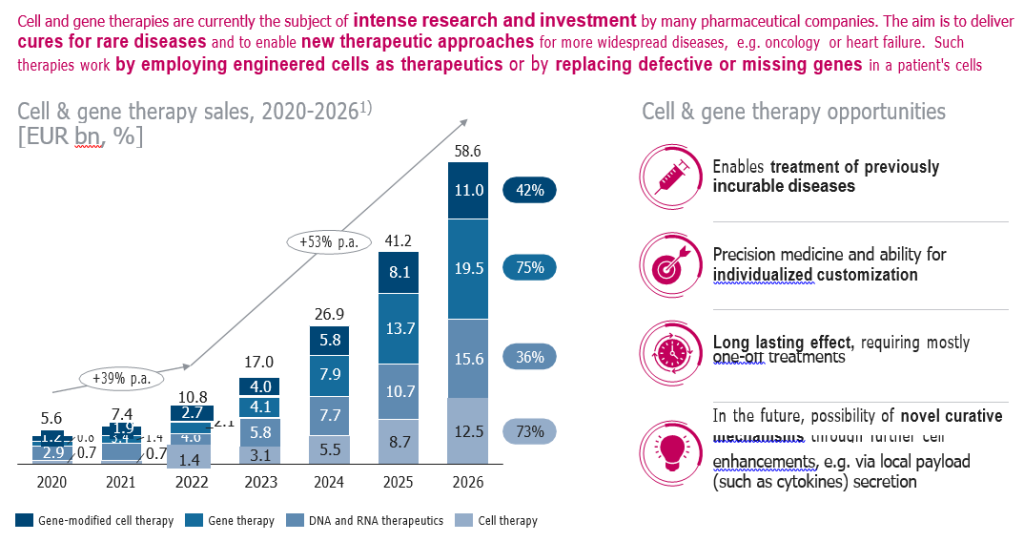
Cell and gene therapies exemplify highly promising innovations enabling restoration of biological function and treatment of as yet incurable diseases
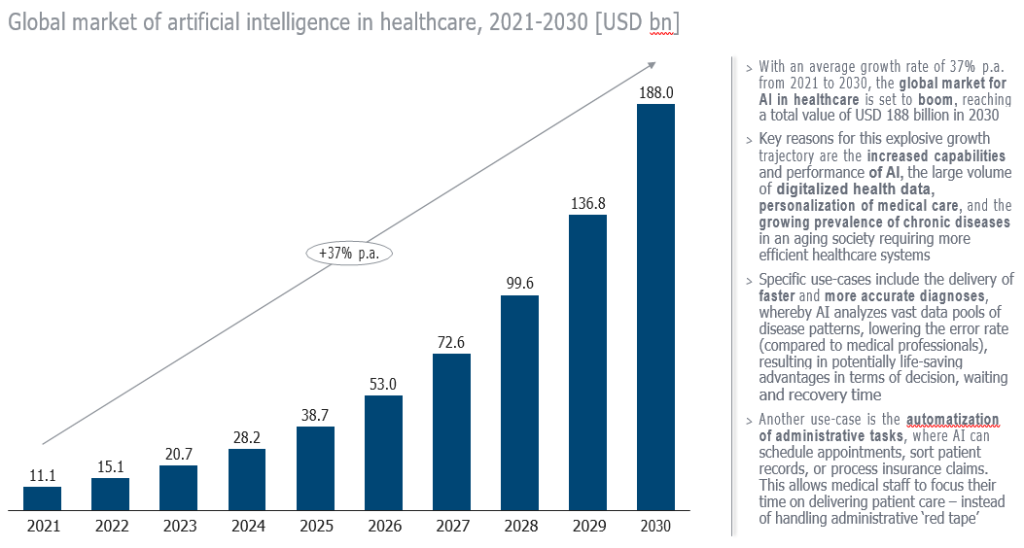
Artificial intelligence capabilities are increasingly entering the healthcare sector, signaling faster, life-saving diagnoses as well as cost reductions
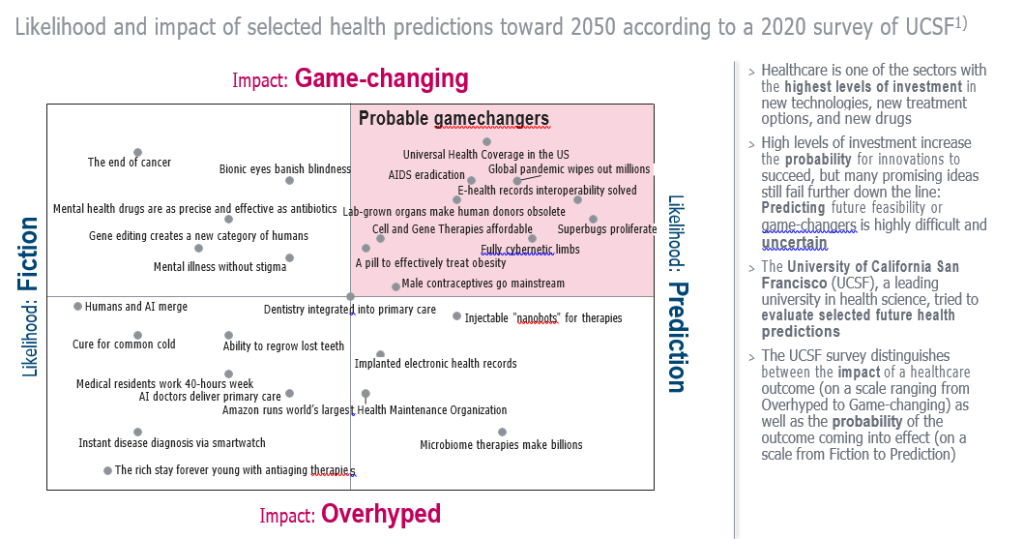
Between fiction and prediction: Advances in healthcare are subject to many expectations – Not all are likely to materialize by 2050
6.3
Caregiving
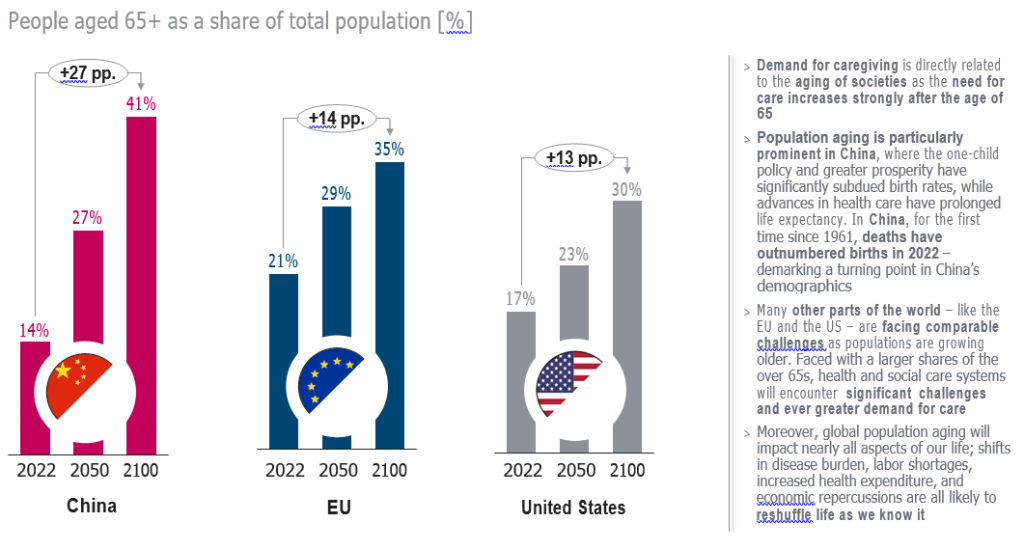
Caregiving is a key part of health and care systems: Elderly people require the largest share of caregiving, and this will increase in aging societies
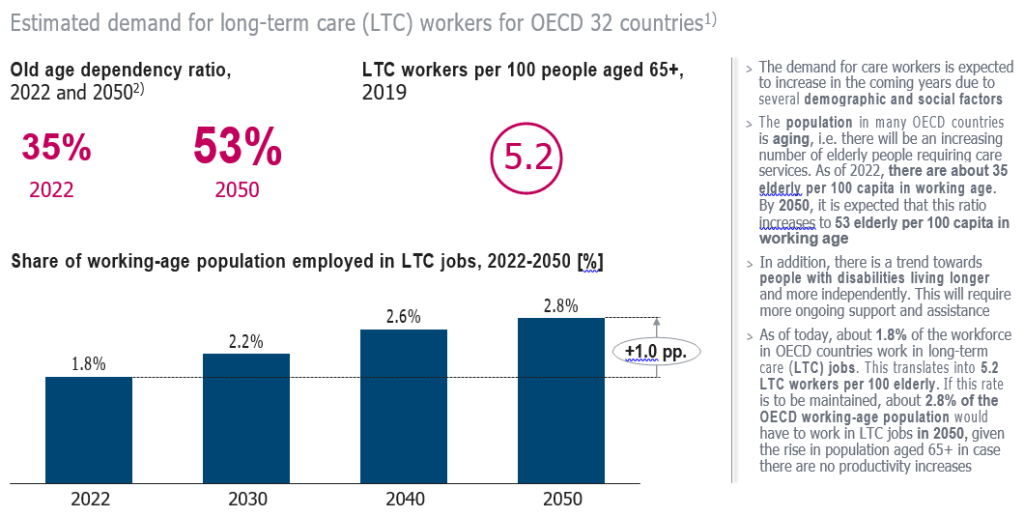
A rising number of professional caregivers is required to support the growing number of older people
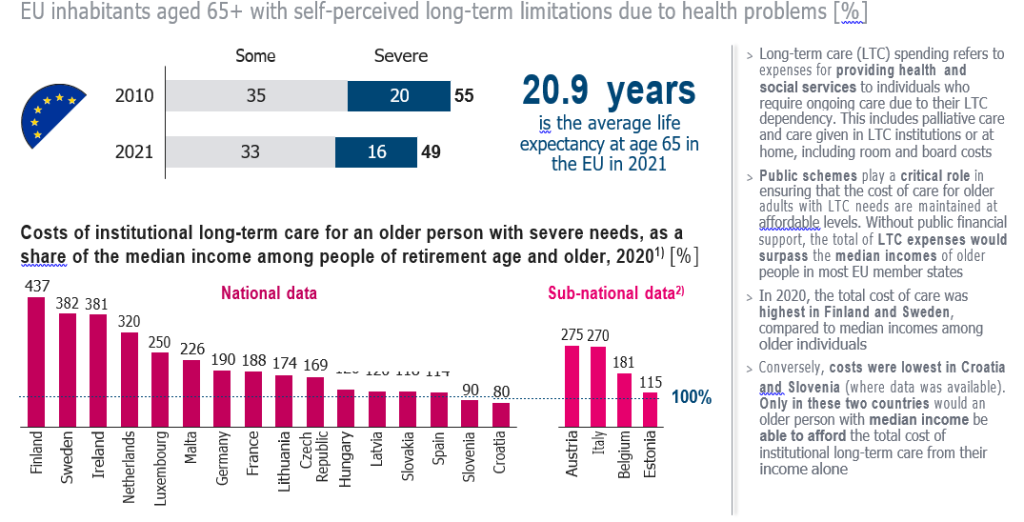
Around half of Europe’s elderly have long-term limitations due to health issues – Retirement income is largely insufficient to cover LTC costs
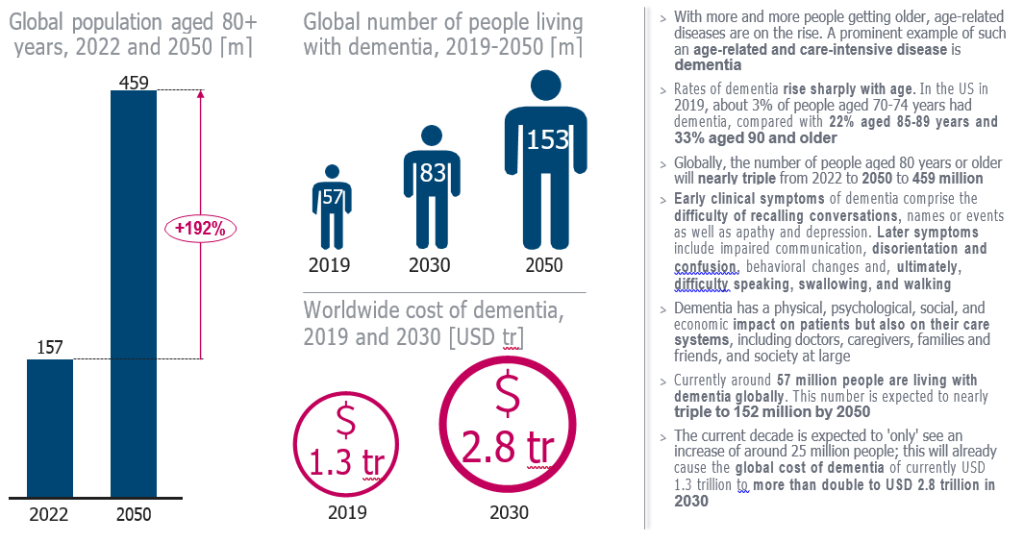
The rise of age-related diseases – such as dementia – also signals a rapidly growing need for cost-intensive care